
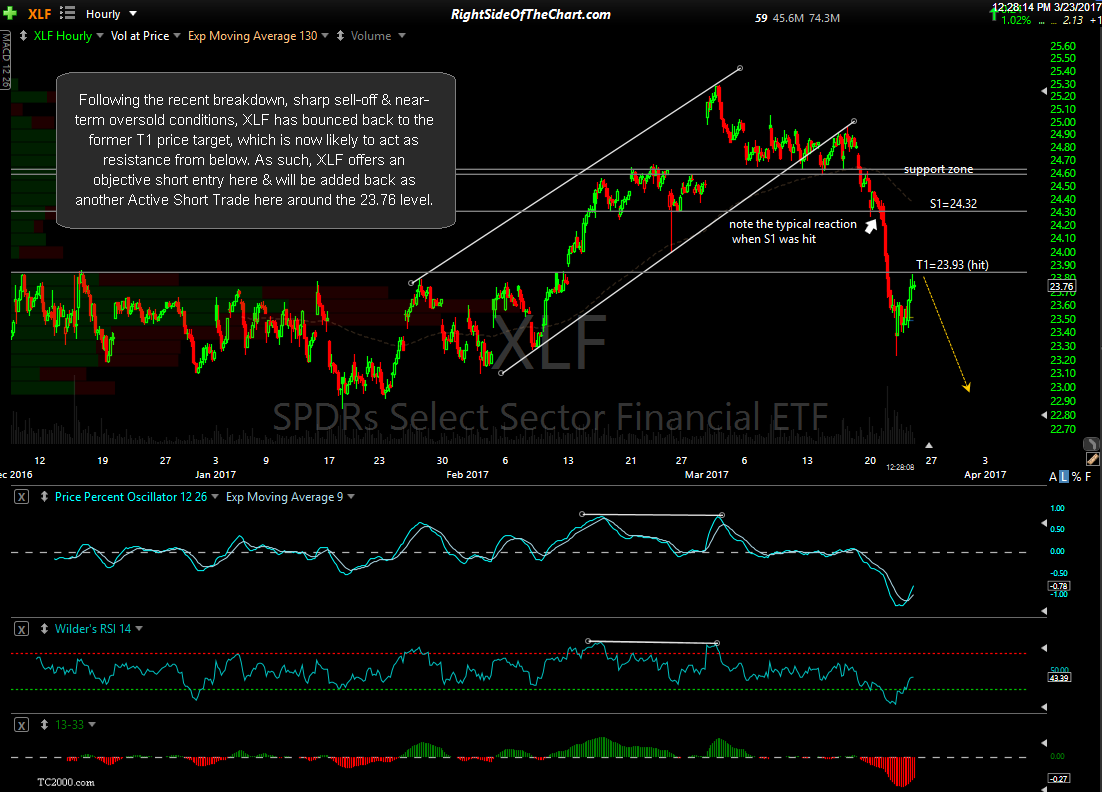
Following the recent breakdown, sharp sell-off & near-term oversold conditions, XLF has bounced back to the former T1 price target, which is now likely to act as resistance from below. As such, XLF offers an objective short entry here & will be added back as another Active Short Trade here around the 23.76 level. 60-minute chart:
XLF 60-min March 23rd
Zooming out to the daily chart below, it appears that this is only the first counter-trend bounce in what is likely to be a much larger correction following the recent breakdown below this rising wedge pattern in XLF. Price targets for this trade are T1 at 23.06 and T2 at 22.52 with the potential for a third price target to be added around the 22.10 area, depending on how the charts of both the financial sector and the broad market develop going forward. The suggested stop for this trade is any move above 24.25 with a suggested beta-adjustment of 1.0.

XLF daily March 23rd
As with any trade, this one may or may not pan out. The important thing is that if you believe that the pullback in the market is over & the market and/or financial sector is headed to new highs, then pass on this trade. However, if you believe there will likely be more downside in the coming days or weeks then you want to sell/short the rips, not when the market is trading down sharply & oversold. It’s really no different from buying the dip when you are waiting to get into a long trade candidate & the stock or ETF offers an objective long entry on a pullback to support… only in reverse when shorting.