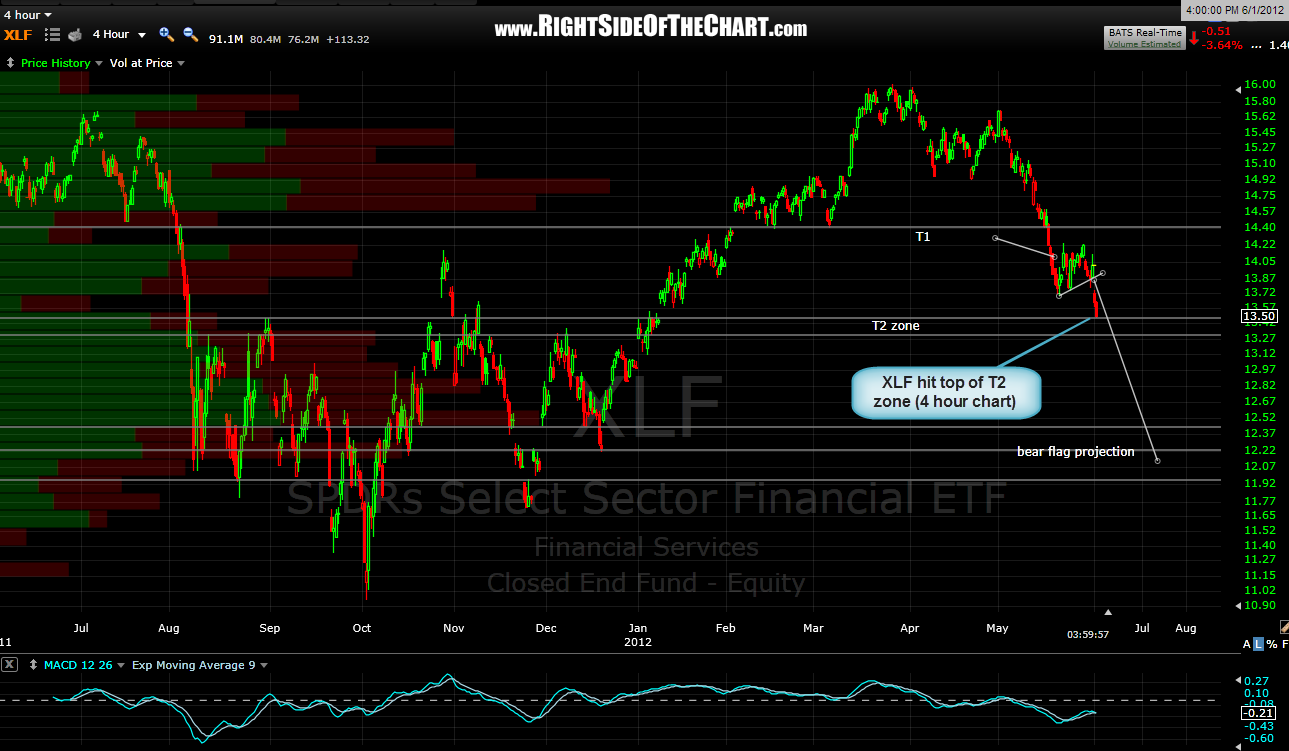
edit: 5:24pm ET: mistakenly missed uploading today’s 4 hour updated chart showing the top of T2 zone hit. there should now be 4 charts below.
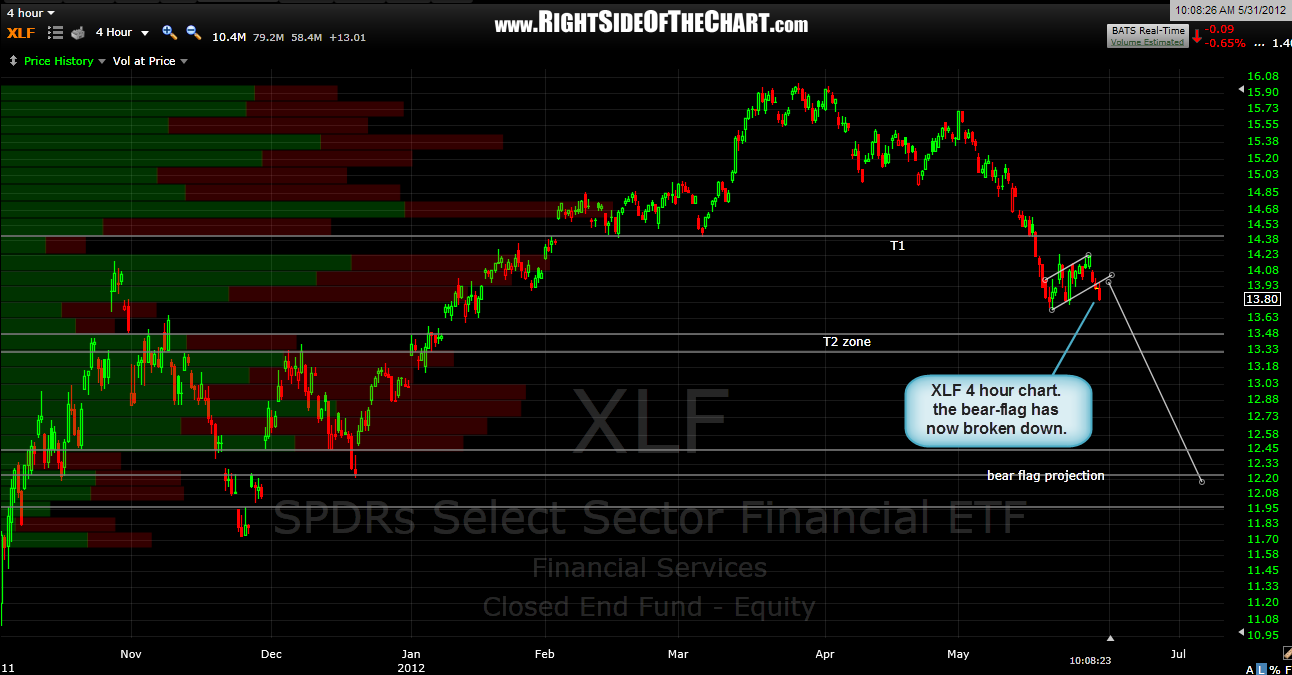
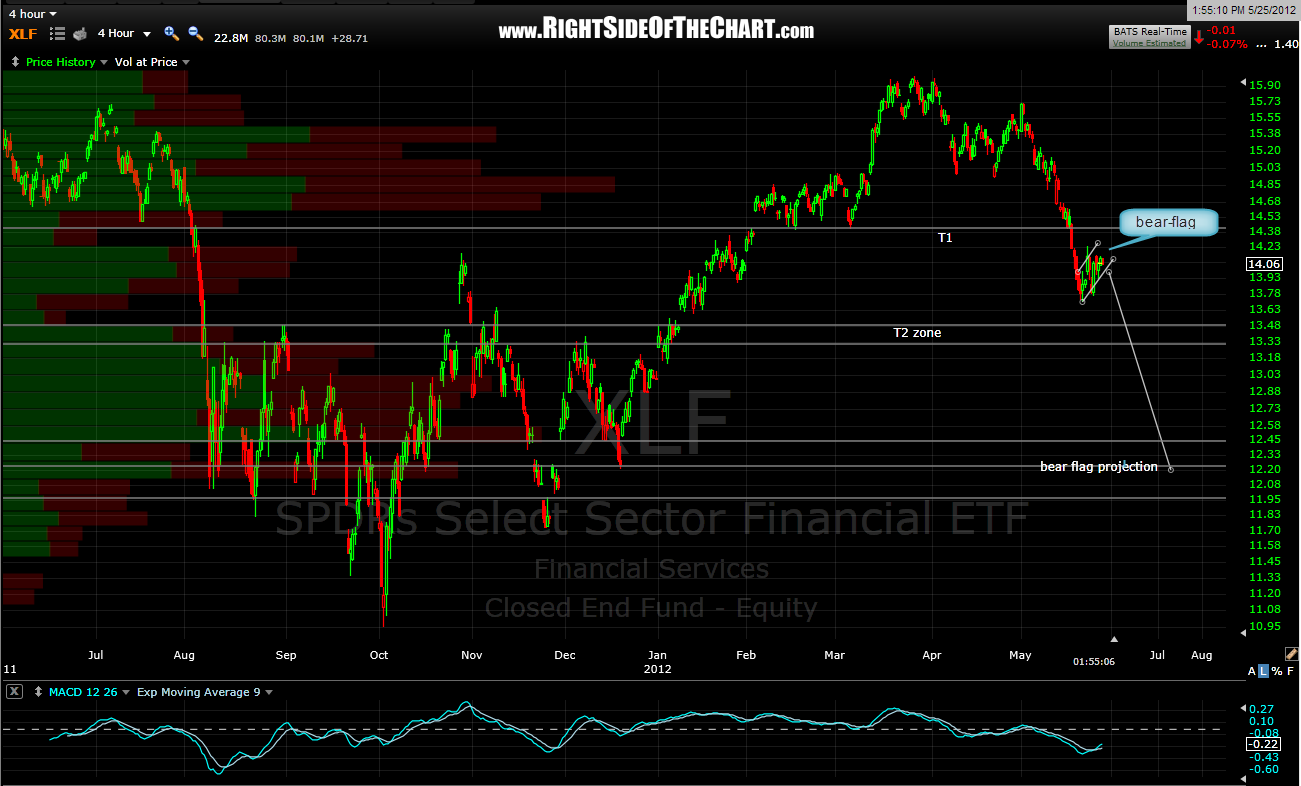
be advised that XLF just hit the top of the 2nd target zone on the 4 hour chart today. although the bear-flag projection is much lower, anytime one of these targets are hit, the odds for a bounce increase until/unless that support level is broken. personally, i’m rolling the dice and taking my financial shorts home over the weekend as i am willing to give back some of the recent gains if caught on the wrong side of a gap on monday in order to make what could be considerable additional gains if that gap happens to go my way (down vs. up). again, it’s all about R/R. betting randomly on a gap being up or down is 50/50 in a vacuum but based on the case that i’ve made for additional downside, i think the potential downside from current levels outweighs the odds of some fed induced gap up on monday by a wide enough margin to take that risk.
btw- i did not have the time to go over the fixed income charts as i had planned but i will be pouring over the charts this weekend so i should be able to get some of those bond charts out in the next day or two. have a great weekend.