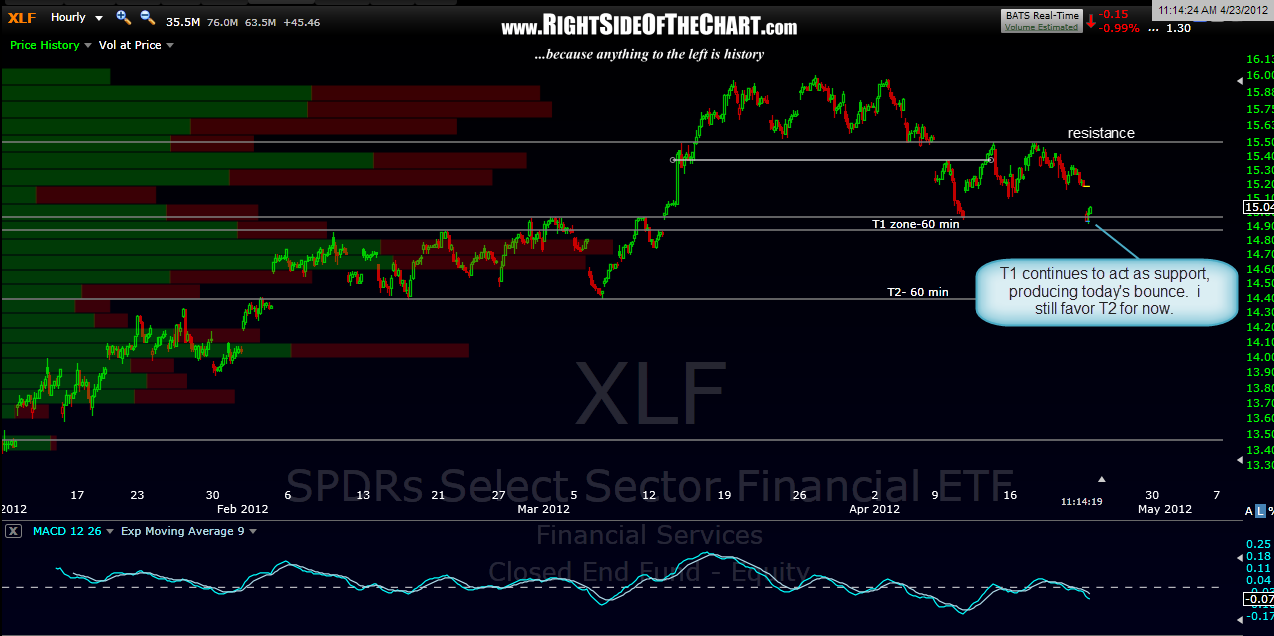
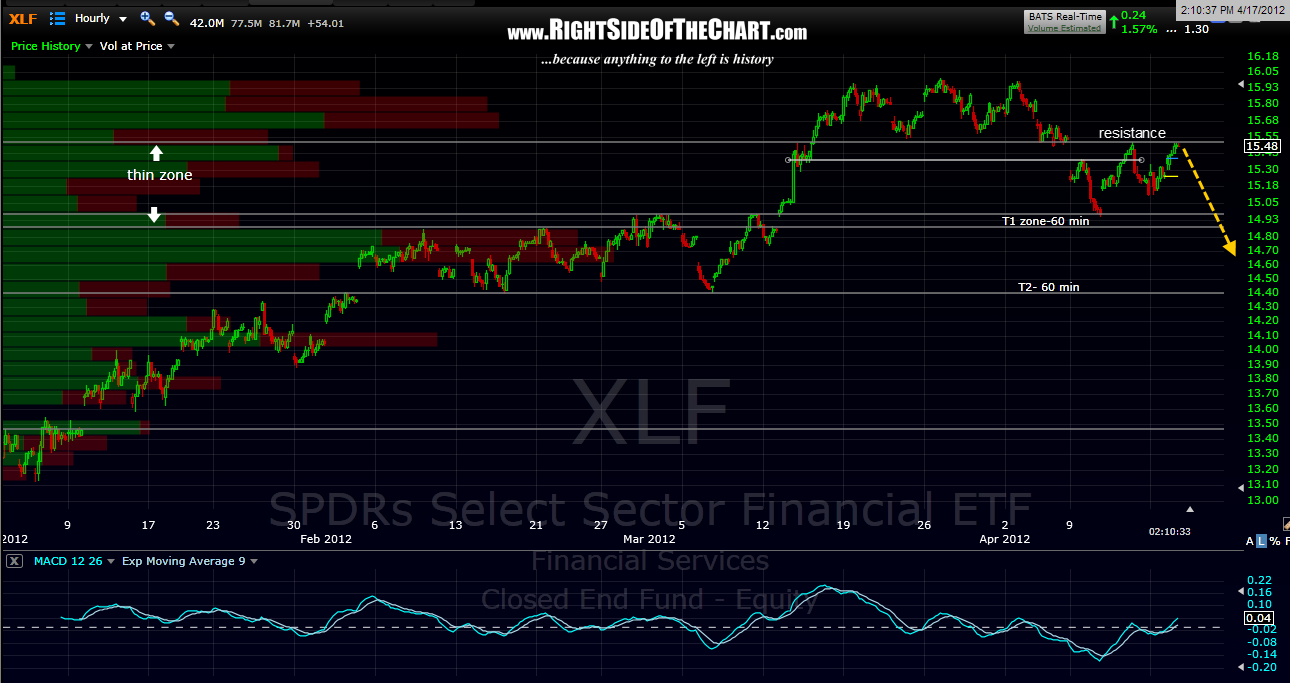
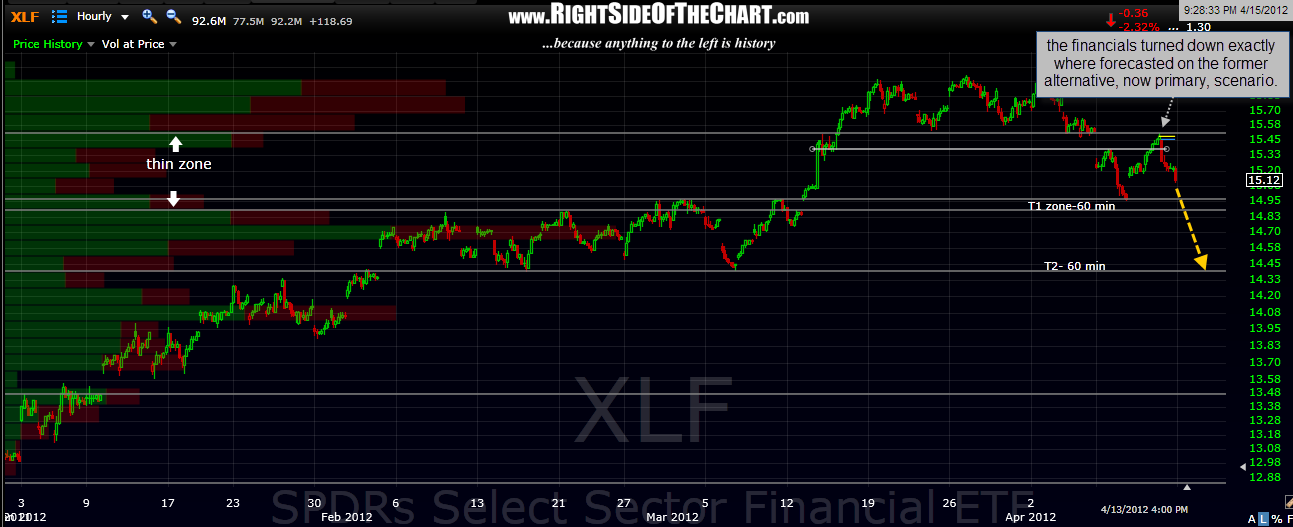
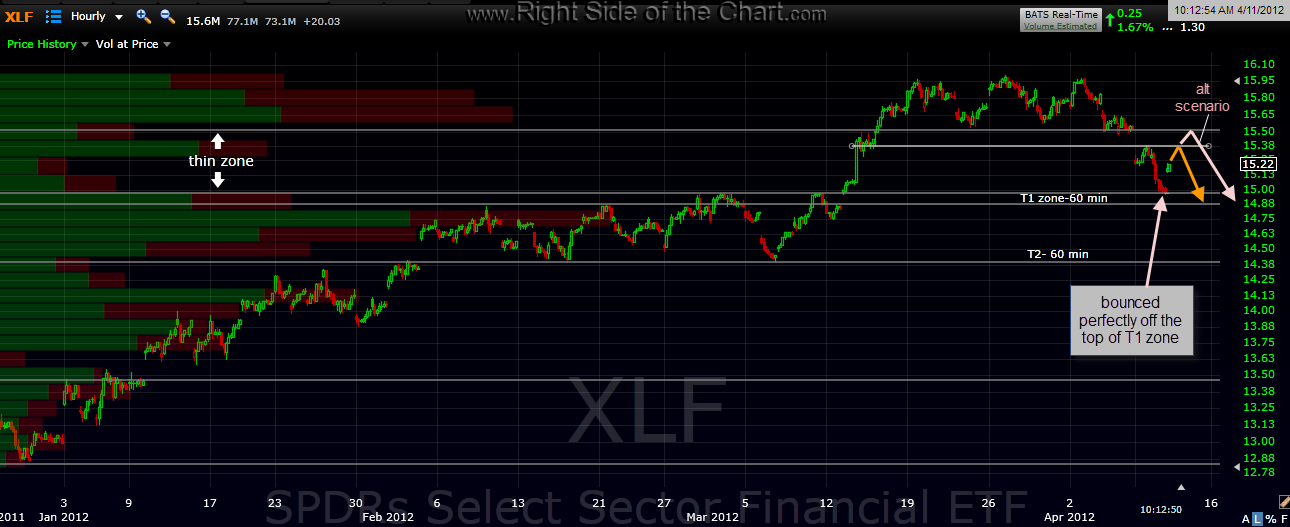
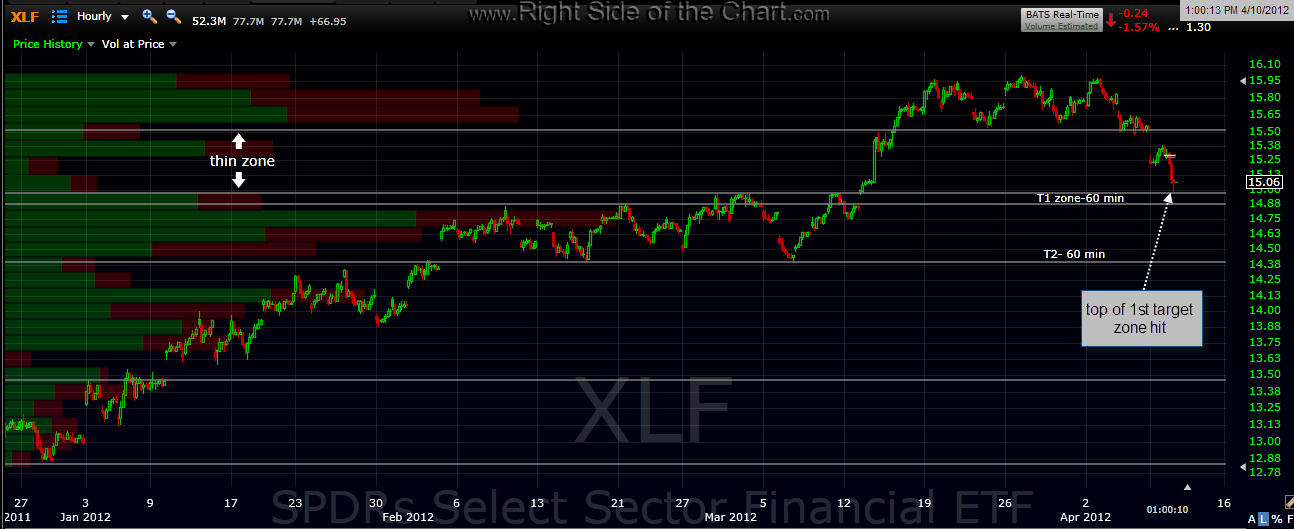
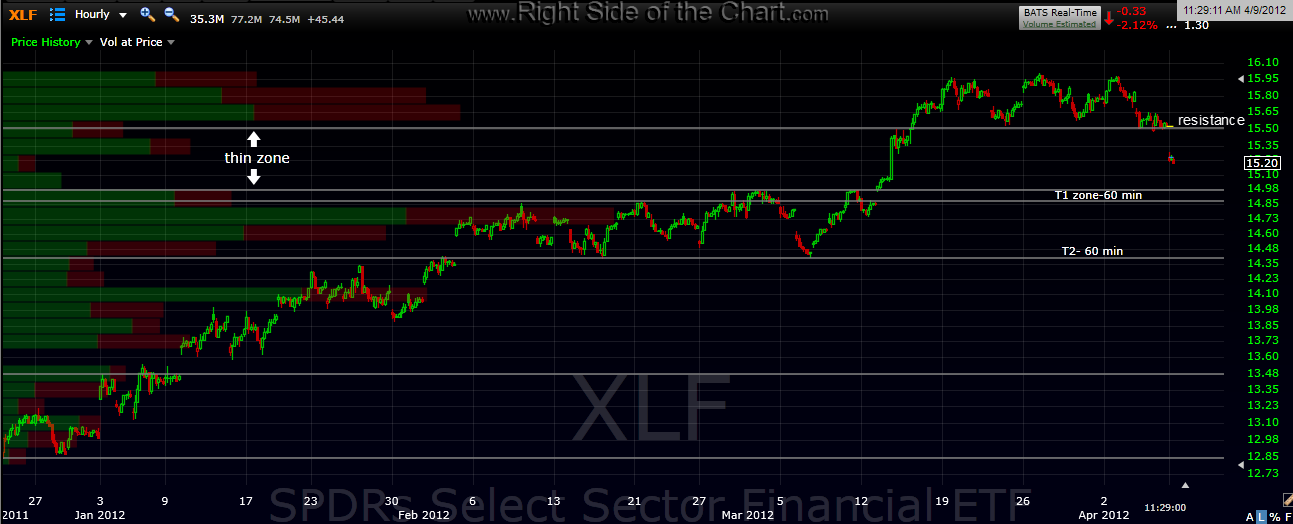
XLF once again finding support at the T1 level, so far producing the bounce off the lows today. for now, i still believe the odds favor T2 being hit before any meaningful bounce but we need prices to break the bottom of this target zone in order for that to play out. keep in mind that i often post the previously posted charts for a visual reference to show how a trade or a scenario has been playing out vs. the original forecast. this is also a useful educational tool for those new to technical analysis as well as more experienced traders trying to get a feel for my own charting style. for those only interested in the current chart can just click the 1st one (most recent). XLF 60 min charts in reverse order below: