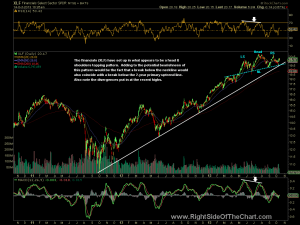
 The financials (XLF) have set up in what appears to be a head & shoulders topping pattern. Adding to the potential bearishness of this pattern would be the fact that a break below the neckline would also coincide with a break below the 2-year primary uptrend line. Also note the divergences put in at the recent highs. 3-year daily chart shown (or click here to view the live chart).

