
 Here’s a 15 minute chart of XLF. The previously posted stop parameter on the recent short trade was 18.60, which in hindsight (my apologies for not mentioning sooner) was probably too tight. If you did stop out, fine. This market is still in BTD (buy-the-dip) mode until proven otherwise and you can always re-enter here or wait for some better technical evidence of a trend reversal.
In the past I have often mentioned my preference to use the candlestick close (or bar, if using a bar chart) of the time frame that the trade was based on as the criteria for triggering an entry or a stop on a trade. Utilizing this method has it pros and cons with the advantages (sometimes) being the avoidance of false signals, such as very brief spikes above or below a trendline or support/resistance level, which can trigger a false entry or stop. If you note on the majority of trendlines that I draw, I will often exclude candlestick tails and wicks, assuming there are just a few wicks/tails that have pierced the trendline.
In the case of the XLF short, prices very briefly exceeded the suggested stop of 18.60 by just 5 cents yesterday, or less than 3/10ths of 1%, before falling back under the stop level and printing a daily candlestick close back below the stop level. If there is one thing that I strive hard to avoid on this site it would be the all-to-common 20/20 hindsight analysis. However, it becomes nearly impossible to continually reiterate and mention every potential possibility and nuance associated with each trade at the time the trade idea is shared and just as unmanageable to be able to keep on top of all active trade ideas and trade setups on the site at any given moment.
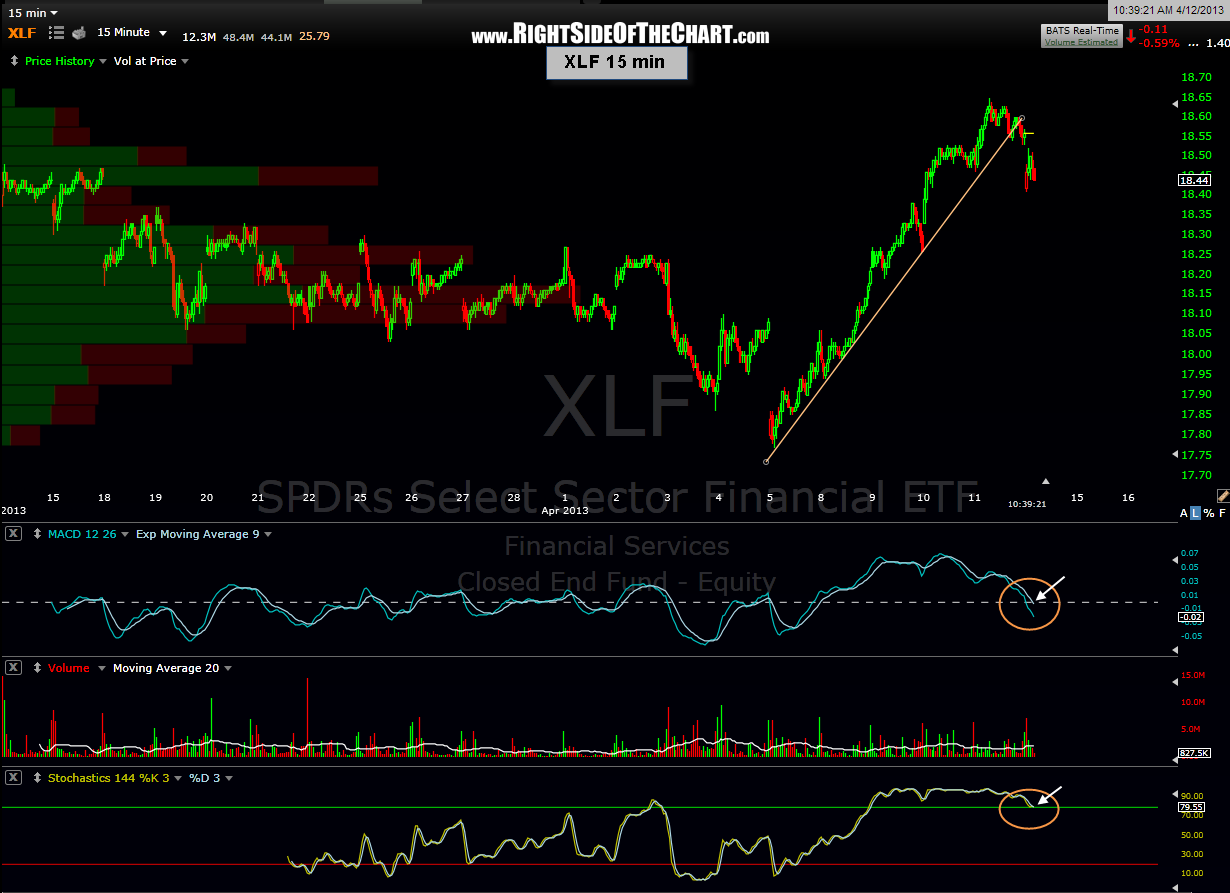
Basically, I have two options with XLF: Either considered the trade stopped out as it did trade over the 18.60 level and then add it back as a new trade now, as I still think that it has a good chance of playing out to the price target and quite possibly beyond (I may add additional downside targets) -or- I could just leave this trade on as an Active Trade for now, for the sake of simplicity, which I will do. This is an updated 15 minute chart of XLF showing that prices have broken below a well-defined uptrend line and are poised to trigger an additional sell signal(s), should the MACD cross below the zero line and the 144 stochastics cross back below the 80 level, both of which I realized happened between the time it took to make that chart and type this post.
On a related note, as of this morning, we have also received those same sell signals on the IWM 15 minute chart, as posted yesterday afternoon. Therefore, we have several key indices and sectors recently triggering multiple short-term sell signals which, I believe, have the potential to be the catalyst for additional sell signals on the intermediate (e.g.-60 minute charts) and possibly longer-term (daily/weekly) time frames… sort of like a domino effect if you will.