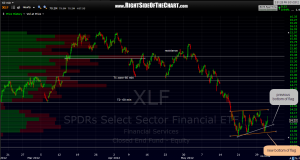
 regarding the post on the XLF 60 minute chart below, as well as many of the other flags that appeared to have broken down today, one could also just view that move down as prices continuing to form the patterns, like the new (and more symmetrical) bear-flag shown below on this 60 minute XLF chart. i still maintain a bearish bias but think that it’s prudent to either take some partial hedges if heavily short, or hold off until we see a clear resolution (up or down) from these patterns, which will most likely be tomorrow or monday. with the retail investor all but gone from this market, all that’s left are a few daytraders and the big institutions, which find thin markets like this a playground for whipping around prices and running the stops on both long and short retail investors and traders, especially via the use of HFT computers. take away from that: either accept the volatility, step aside, or loosen your stops, otherwise you run a good chance of being stopped out. XLF 60 minute with the possible new flag pattern drawn in orange shown here.

