
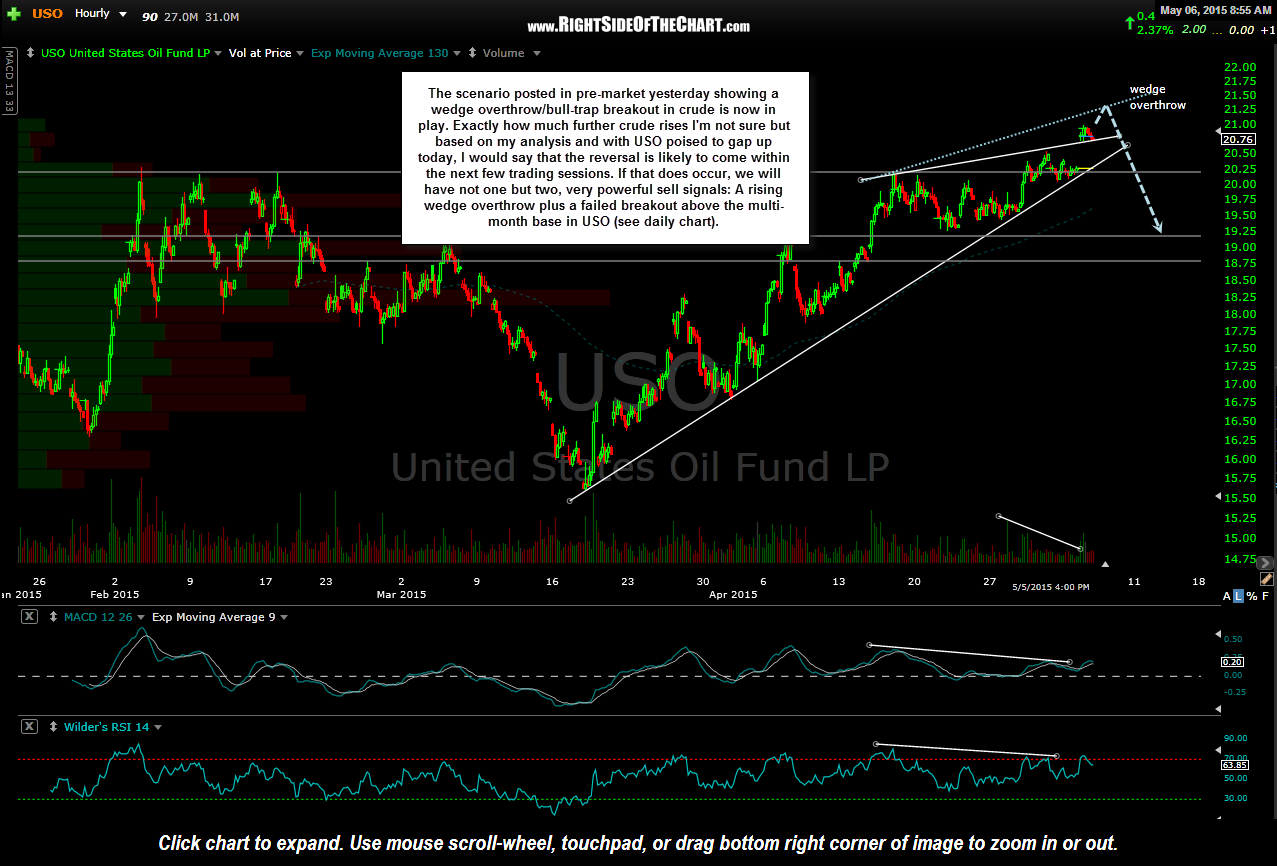
USO 60 minute May 6th
The scenario posted in pre-market yesterday showing a wedge overthrow/bull-trap breakout in crude is now in play. Exactly how much further crude rises I’m not sure but based on my analysis and with USO poised to gap up today, I would say that the reversal is likely to come within the next few trading sessions. If that does occur, we will have not one but two, very powerful sell signals: A rising wedge overthrow plus a failed breakout above the multi-month base in USO (see USO daily chart found in the Live Charts link on the homepage sidebar).
Although I’ve explained my reasoning for opting to short ERX (3x Energy Bull ETF) vs. long ERY (3x Energy Bear ETF) or even a larger amount of XLE (1x long SPDRs Select Energy ETF), here are some real-world stats to validate my claims that an ERX short is likely to outperform an ERY long or XLE short (position size adjusted to account for the leverage, i.e.- in percentage returns).
To begin with, unlike some popular leveraged ETFs against their similar non-leverage counterparts from another ETF provider, XLE, ERY, & ERX all aim to track the exact same sector; the S&P Energy Select Sector Index, making this as close to an apples-to-apples comparison as you can get.
Although the two 3x leveraged ETF from Direxion, ERX & ERY, have already reported reported performance statistics through the end of April, XLE (from the SPDRs ETF offerings) has only performance stats through the end of March at this time. That works fine as we can compare the results for the 1st quarter (Q1) of 2015. That also works well since as I stated in the original short entry for ERX that I was (and still am) undecided whether I will book relatively quick profits at the 63 area or if I allow this trade to morph into a longer-term swing short trade lasting several weeks & possibly months.
Remember, unless you are caught on the wrong side of a uni-directional move (i.e.- a persistent uptrend in the energy sector with very few red closes), there are two factors that work in your favor when short ERX or any leveraged ETF; Time & volatility (up & down closes). This chart shows the performance results for XLE, ERX & ERY. In the first quarter of 2015, XLE lost -1.65. However, largely as a result of the decay from the 3x leverage, ERX lost 9.33% instead of just 4.95% (3 x -1.65%). That’s nearly double the “expected” loss in just 3 months. Instead of gaining +4.95% (which would be the -1.65% loss of XLE multiplied by 3), ERY actually suffered a loss of -3.62% over the same time period. In other words, had you come into the year bearish on energy & placed your bets on a long position in ERY, you would have been right on your “energy sector down in Q1” call yet would have lost money on your bet.
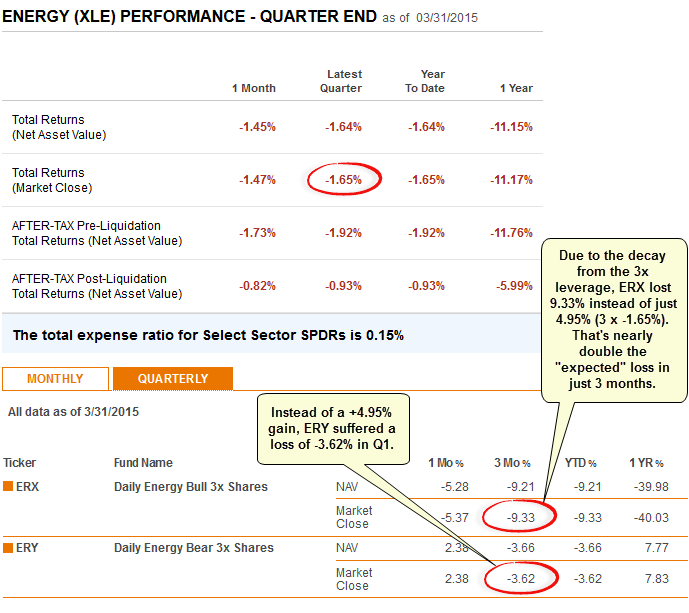
XLE vs. ERX + ERY Performance Comparison
Finally, I took this screenshot of XLE shortly before the market opened so this reflects yesterday’s close. This 60-minute chart shows yesterday’s impulsive breakdown of the previously highlighted 60-minute bearish rising wedge pattern in XLE. With USO gaping higher, XLE is poised to bounce at the open as well. So far that just looks like we’re going to get the normal, short-term oversold counter-trend bounce but XLE still looks good for a move down to at least the 81 area, if not further in the comings weeks/months. As such, ERX & XLE will remain as Short Trade Setups (in addition to Active Short Trades) as they still offer objective entries or add-ons here on today’s bounce.
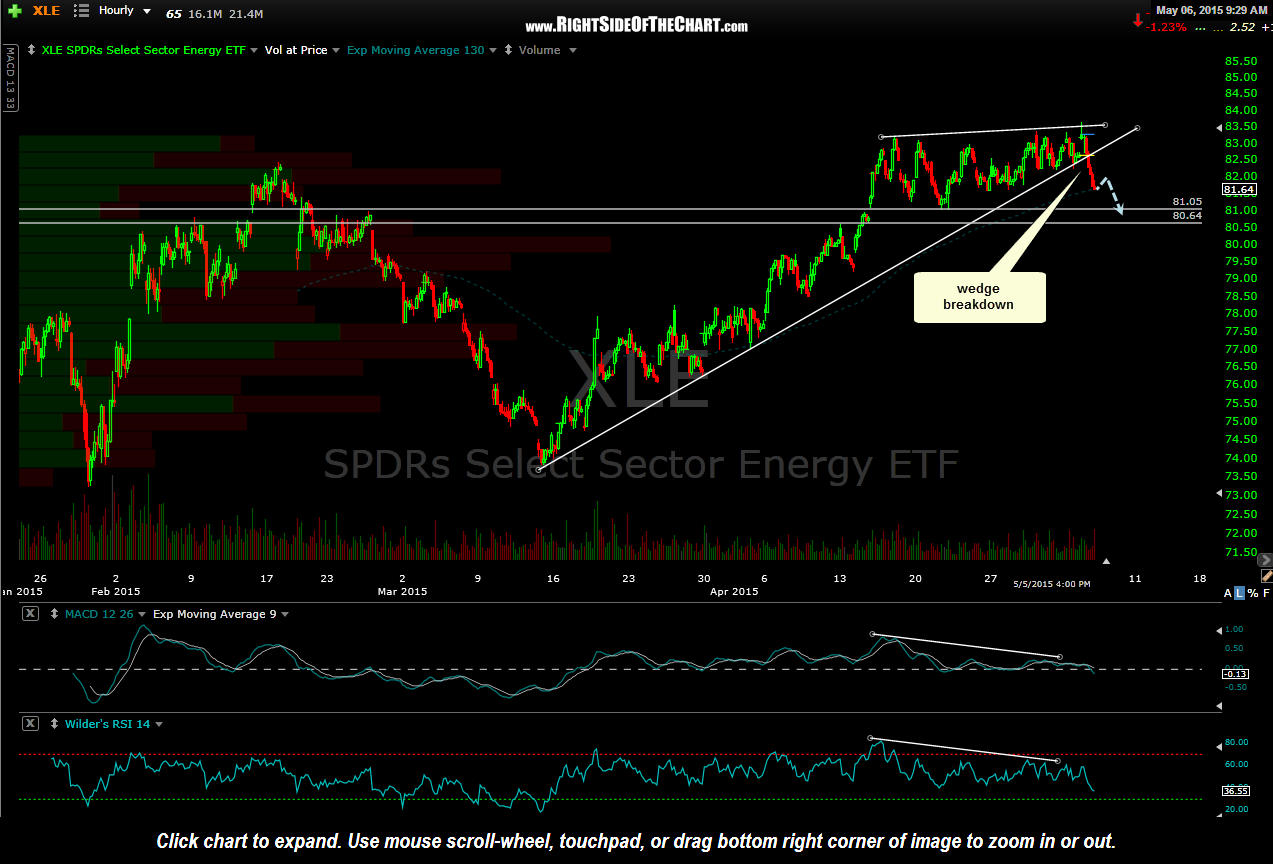
XLE 60 minute May 5th close