
As a follow-up to the May 8th post, S&P 500 Sector Analysis, XLE (energy sector ETF) has now come within 60 cents of that 64ish key support level with the bullish divergences still in place & close to being confirmed (via a bullish crossover on the PPO), should XLE build on today’s gains. Previous chart from the May 8th post followed by the updated daily chart of XLE below:
-
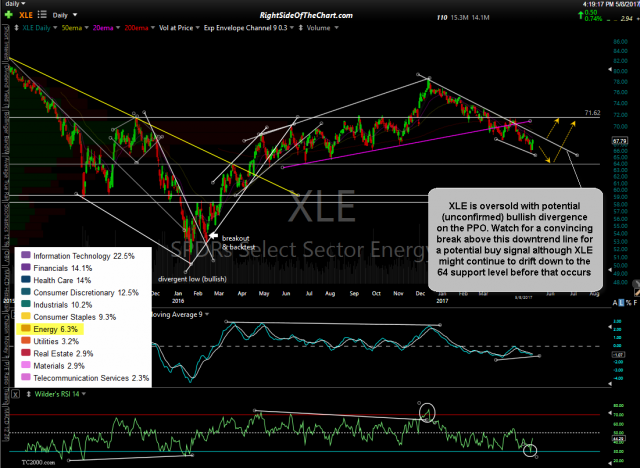
- XLE daily May 8th

-
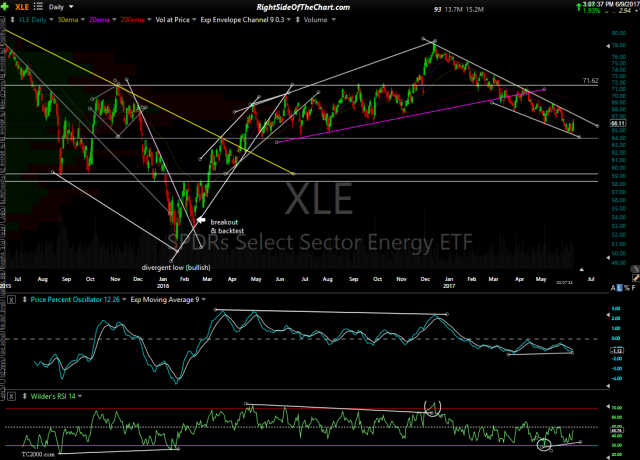
- XLE daily June 9th
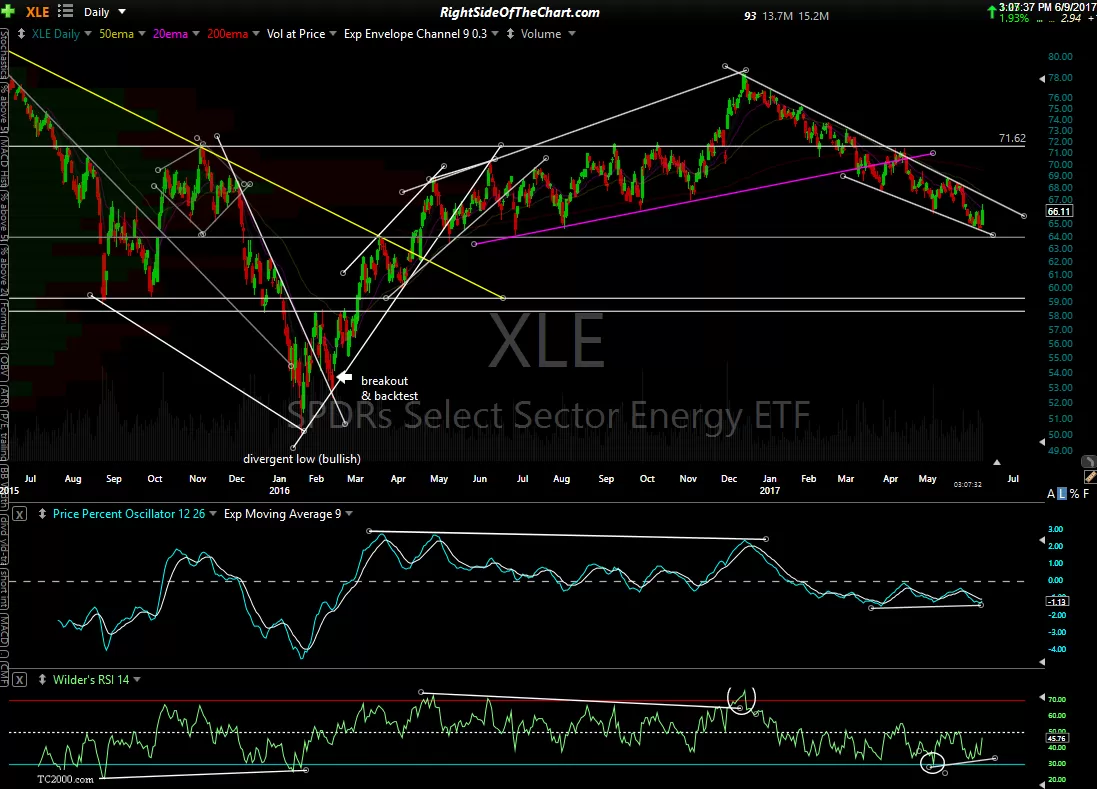
As you can see on the charts above, since that last update a month ago, XLE rallied to stop cold at the top of the channel (downtrend line), reversed & fell nearly 6% to the bottom of the channel & has mounted a decent rally today. Due to the fact that so far today we have very solid, high-probability sell signals on the Nasdaq 100 & the leading FAAMG stocks, although they have no relation to the tech sector, I suspect that the energy stocks are likely to make at least one more thrust down within the wedge over the next week or so, should the $NDX & the broad market continue lower next week as I suspect they will. As such, XLE as well as it’s cousin, XOP (oil & gas exploration & production ETF), are on watch for potential long-side swing and/or trend trades.