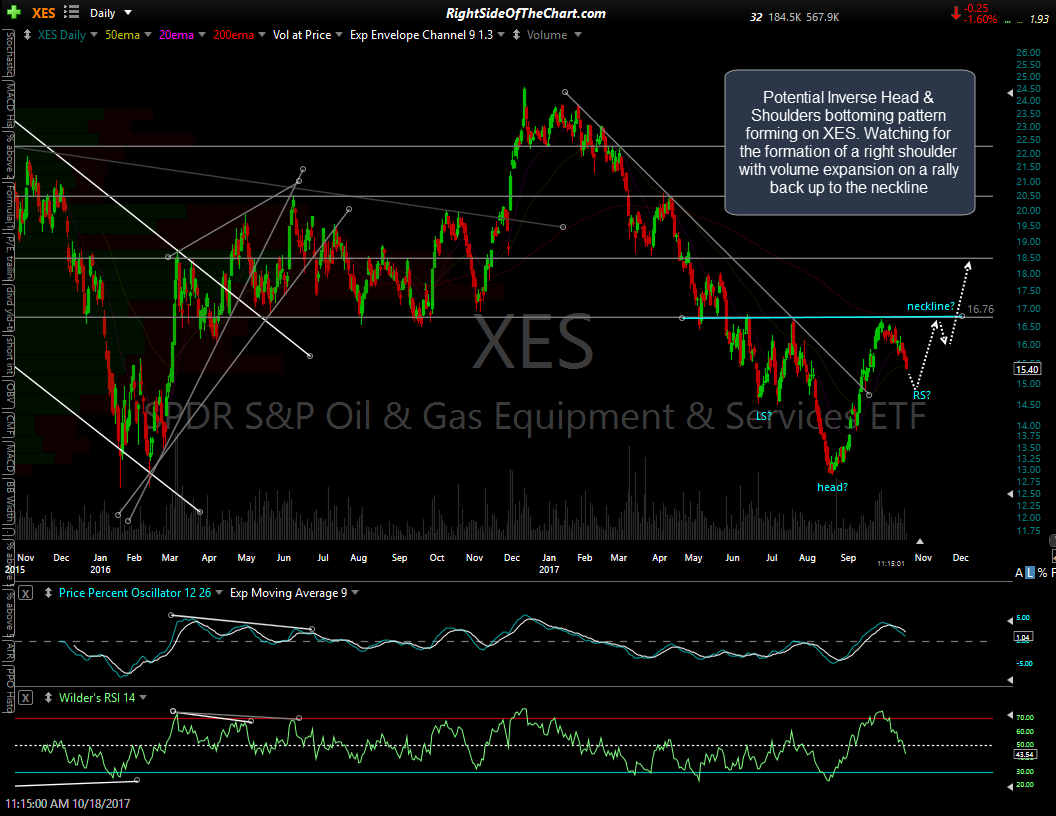
XES (Oil & Gas Equipment & Services ETF) could be in the process of forming an Inverse Head & Shoulders bottoming pattern. A little more downside in XES followed by a resumption on the primary uptrend in energy stocks would be inline with my recent scenario for a correction in the energy sector, which is playing out so far. Ideally, to put nice symmetry on this potential bottoming pattern, would be a drop of another ~4% or so followed by a rally back up to the neckline (16.75ish area) on increased volume.
Should the current negative divergences on the crude futures (/CL) 60-minute chart below play out for another pullback, that would likely bring XES down to the bottom of a fairly symmetrical right shoulder (relative to the left shoulder). A detailed description of a Head & Shoulders bottoming pattern can be viewed by clicking this link.


