
The dashed orange lines on this 30-minute chart of XBI outline my ‘best-guess’ scenario for the biotech sector: a relatively shallow pullback here, followed by one last thrust to new highs before a meaning trend change/correction. This would mesh with an OpEx ramp (the market continuing higher into OpEx this Friday).
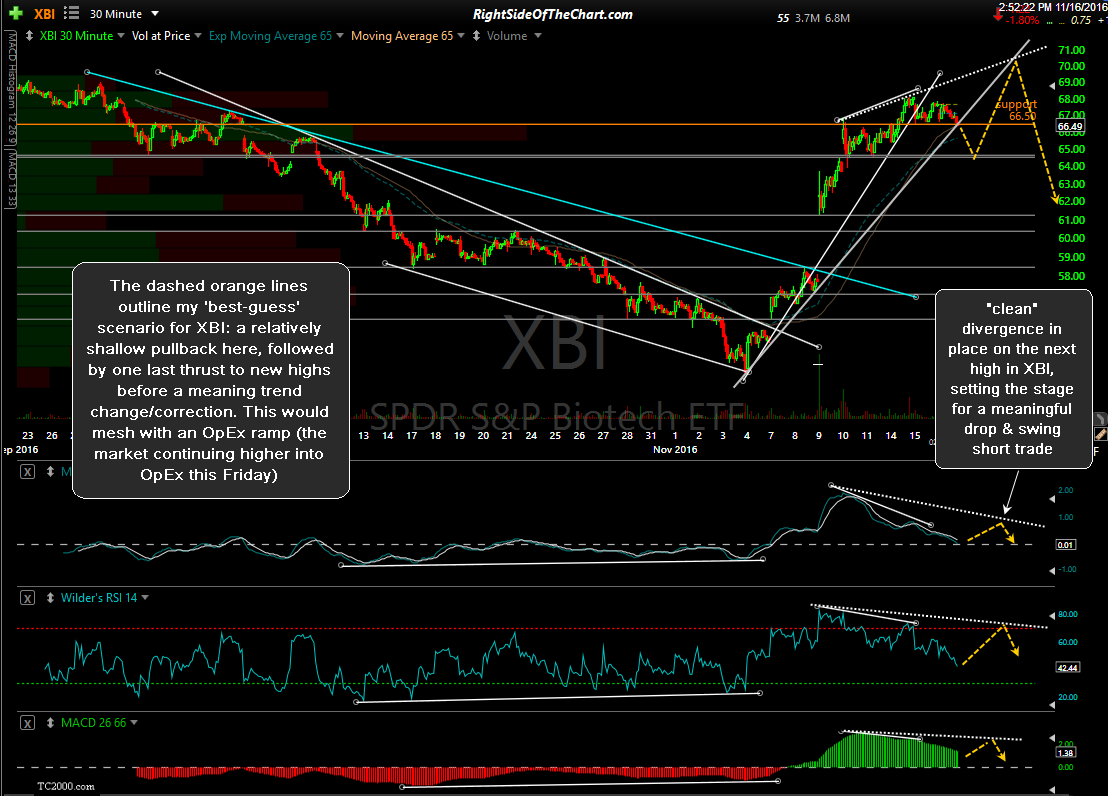
XBI 30-minute Nov 16th
Although there is current negative divergence in place on this 30-minute time frame, as shown with the solid white trendlines on the MACD, RSI & 26/66-ema trend indicator histogram, which could play out for a meaningful trend reversal & move down to any or all of the horizontal support levels/potential targets on this chart, a more favorable setup for entering a swing short trade on XBI or any of the various biotech ETFs would come on after another thrust higher that puts in place what I like to refer to as “clean” divergence. By clean divergence, I am referring to clear separation between the intial reaction high & the subsequent lower reaction high, as outlined with the white dotted trendlines.
For those looking for a potential quick pullback trade, possible more, in the biotechs, XBI does appear to offer an objective short entry here on the breakdown below the 66.50 minor support level with an initial price target around 64.74, which is just above the support zone of 64.60-64.70. Should biotechs start to move lower, one could either cover the short position there or lower stops to at or slightly below entry & let the position run, with the potential for a much deeper correction in the biotechs. Next supports at 61.33, 61.41 & then 58.52ish.