
XBI (SPDR S&P Biotech ETF) is moving impulsively lower after recently breaking below & backtesting this bearish rising wedge pattern, which was confirmed with negative divergences. Next stop should be the 59.90 area although more downside is likely in the coming weeks & possibly months.
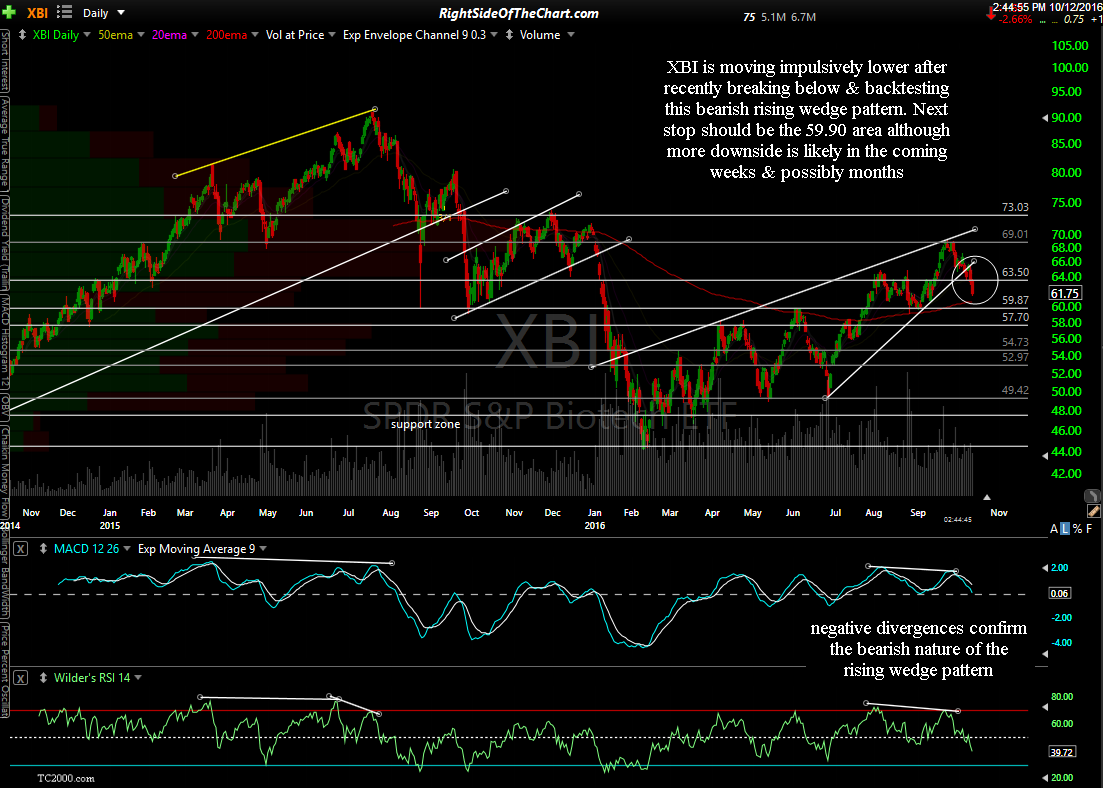
XBI daily Oct 12th
Taking a look at the longer-term time frame on this weekly chart, it appears that so far, the 2016 rally in the biotech sector appears to be nothing more than a typical bear market rally within a large secular bear market that kicked off back in July 2015. Note how this rally recently failed at the 50% Fibonacci retracement level with the PPO now rolling over.
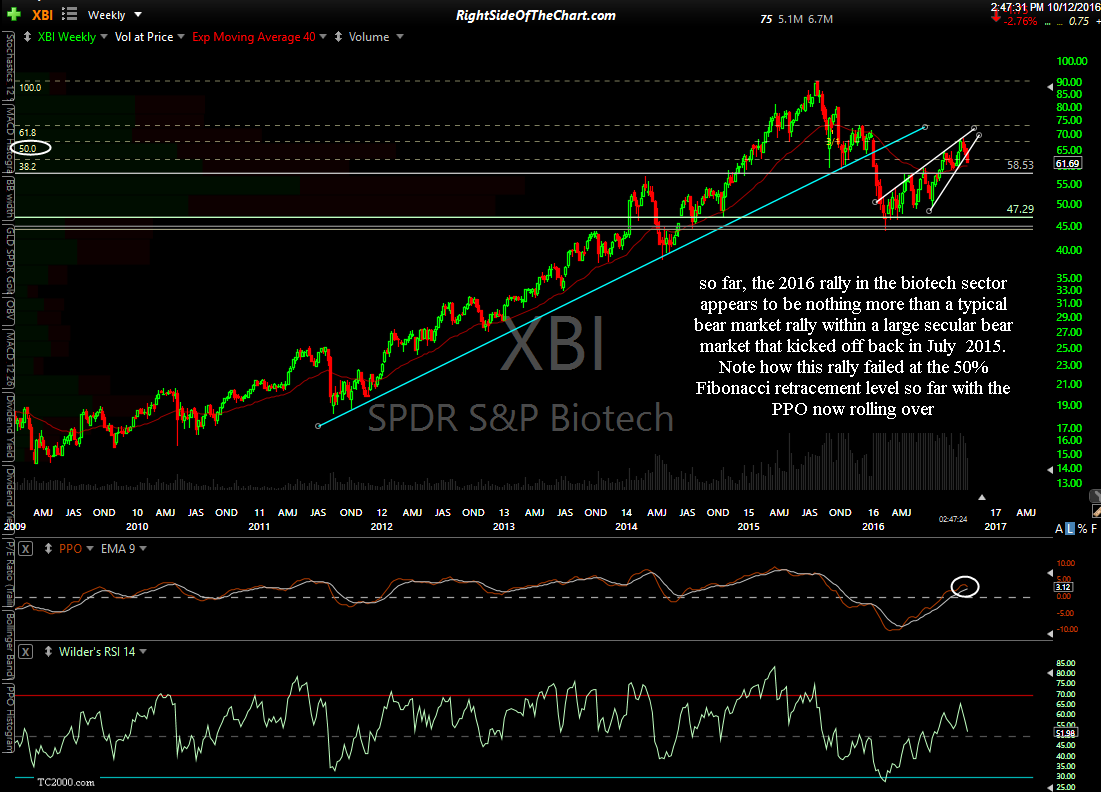
XBI weekly Oct 12th