
So far today, XBI reversed immediately after tagging the primary downtrend line (top of symmetrical triangle pattern which is resistance) & has since formed a doji candlestick on the daily time-frame.
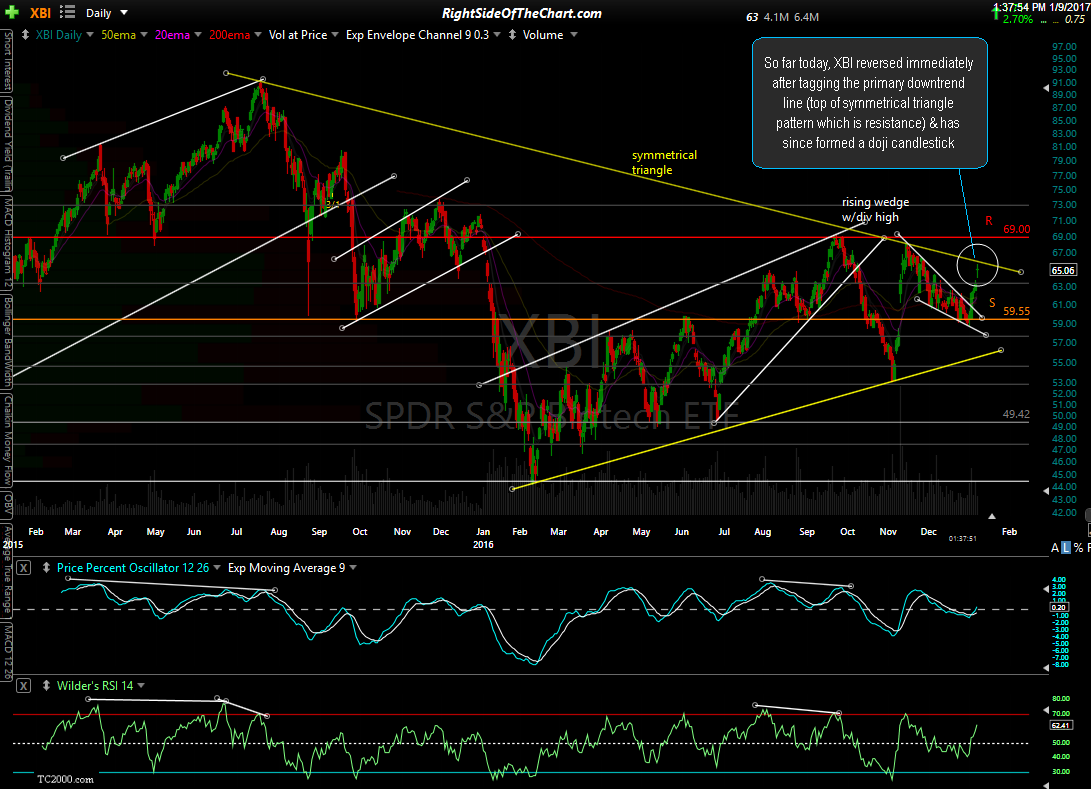
XBI daily Jan 9tth
Zooming down to the 60-minute time-frame, XBI has now hit the measured target for the bullish falling wedge pattern (widest part of the wedge added to the breakout point). Taking both factors into consideration, it appears quite likely that the near-term rally in the biotechs may have run its course for now although should XBI manage to make an impulsive breakout & daily close above the symmetrical triangle pattern, that would open the door for a continued move up to the 69.00 resistance level. The most likely scenario right now IMO would be a pullback to at least the 61.60ish support level in the coming days/weeks.
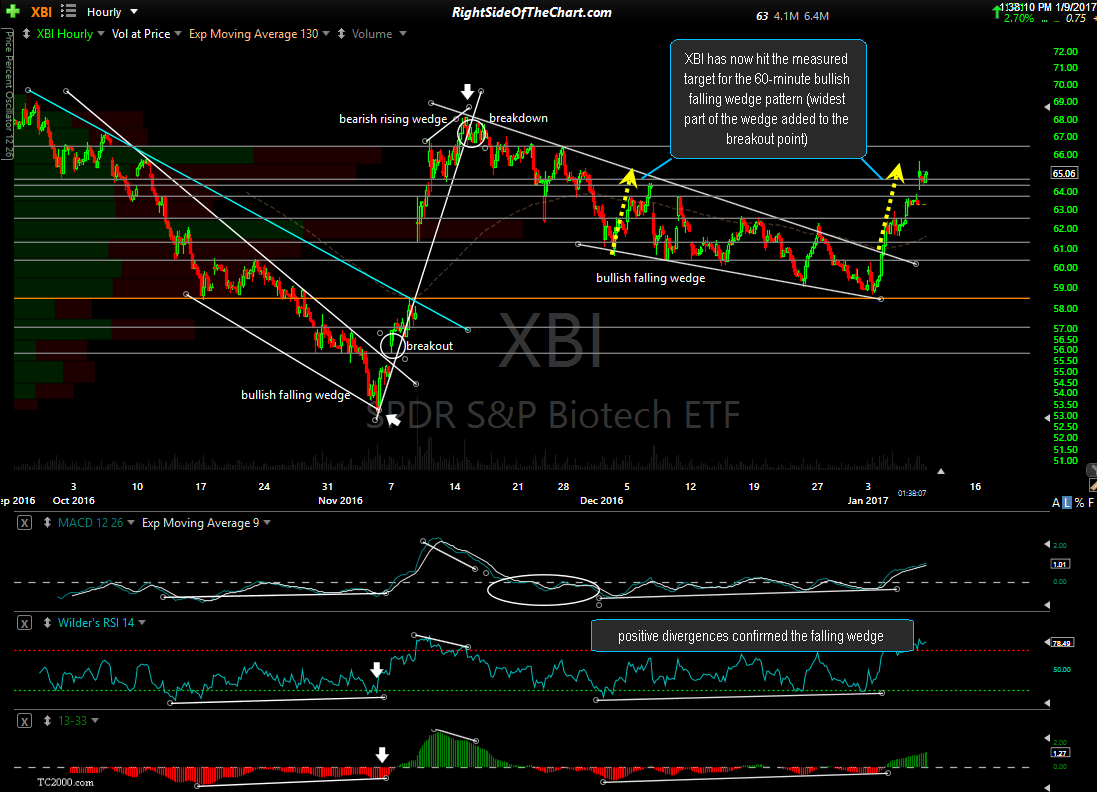
XBI 60-minute Jan 9th