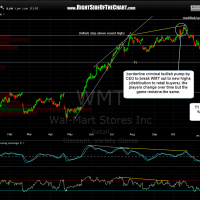
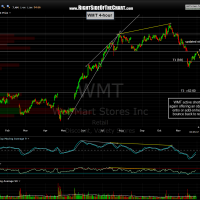
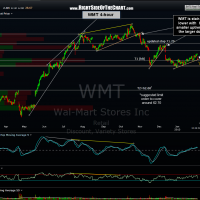
WMT has been an active short for what seems like forever but still looks good. Here’s a string of the last few 4-hour charts with some additional notes (and slightly revised final target) on the last (updated) 4 hour chart. The final chart is an updated daily chart just showing the same pattern from a slightly zoomed-out perspective. As these last two charts clearly show, WMT has been “stair-stepping” lower on smaller uptrends within the larger downtrend that has been in place for months now. I moved the suggested target up by 10 cents since I have recently started to list my preferred profit taking level as the price target(s). In the past, I would list the actually level or support or resistance where I expected a bounce/reversal to occur but as I’ve often stated, my preference is to set my sell limit orders (on longs) or buy-to-cover limit orders (on shorts) slightly below/above those levels as to help avoid barely missing a fill as there are often clusters of orders sitting at or just below/above those key support & resistance levels if too many eyes are watching them.
Results for {phrase} ({results_count} of {results_count_total})
Displaying {results_count} results of {results_count_total}


