
Arrow breaks denote initial price targets following the recent divergent low + downtrend line breakout & backtest on /ZW wheat futures. 120-minute chart below.
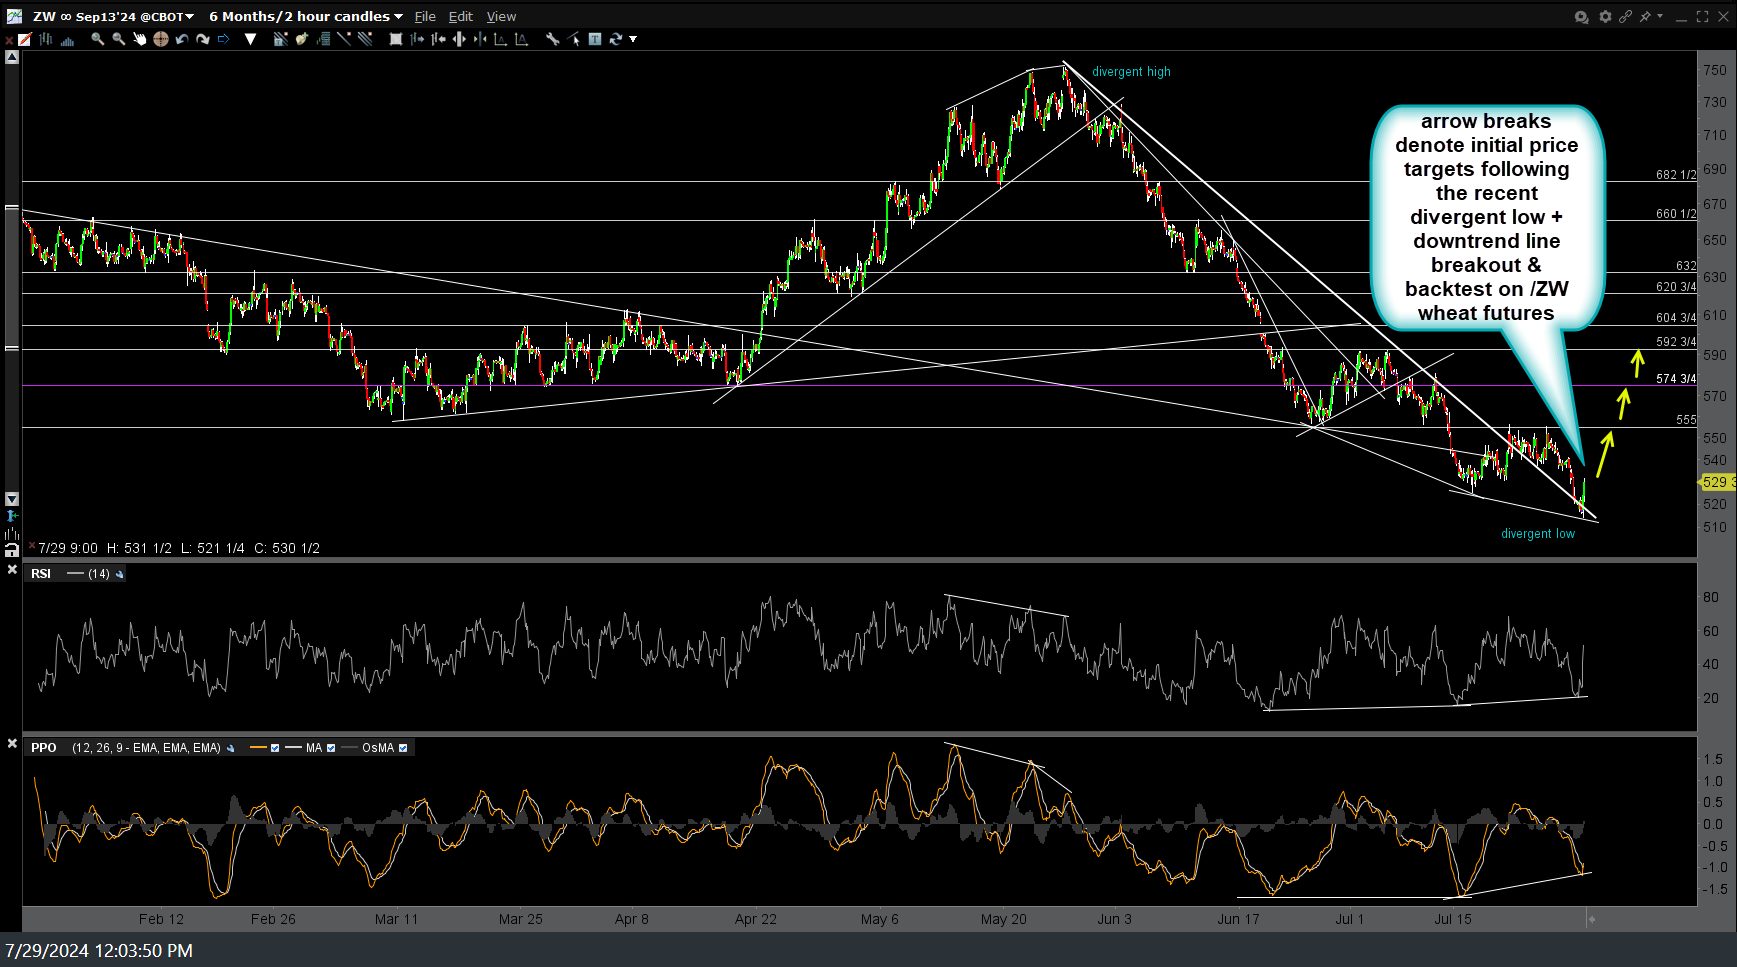
ZW 120m July 29th
/ZC corn futures should run if it can clearly take out the 412ish resistance on this 120-minute chart below.

ZC 120m July 29th
The 120-minute chart below lists some new price targets for /ZS soybeans with T1 coming in around the intersecting downtrend line + 1050 price resistance.

ZS 120m July 29th
If anyone wants updated charts on any of the grain ETN’s (WEAT, CORN, and/or SOYB) just let me know in the comment section below.