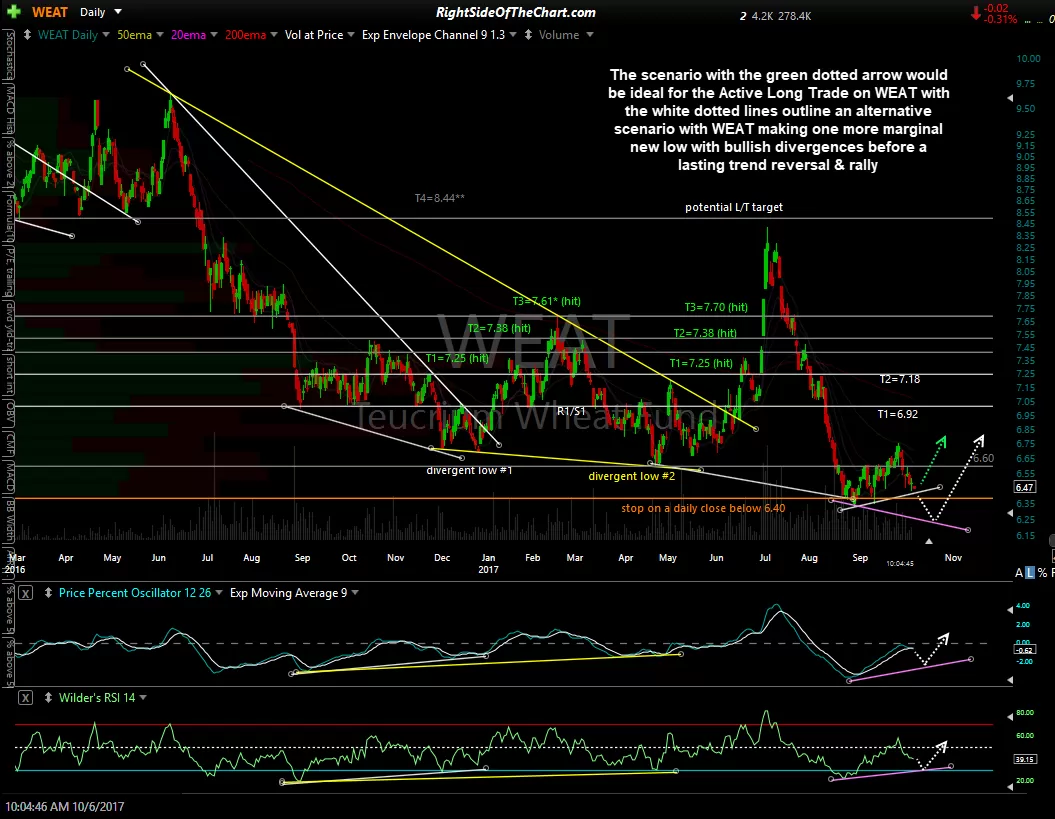
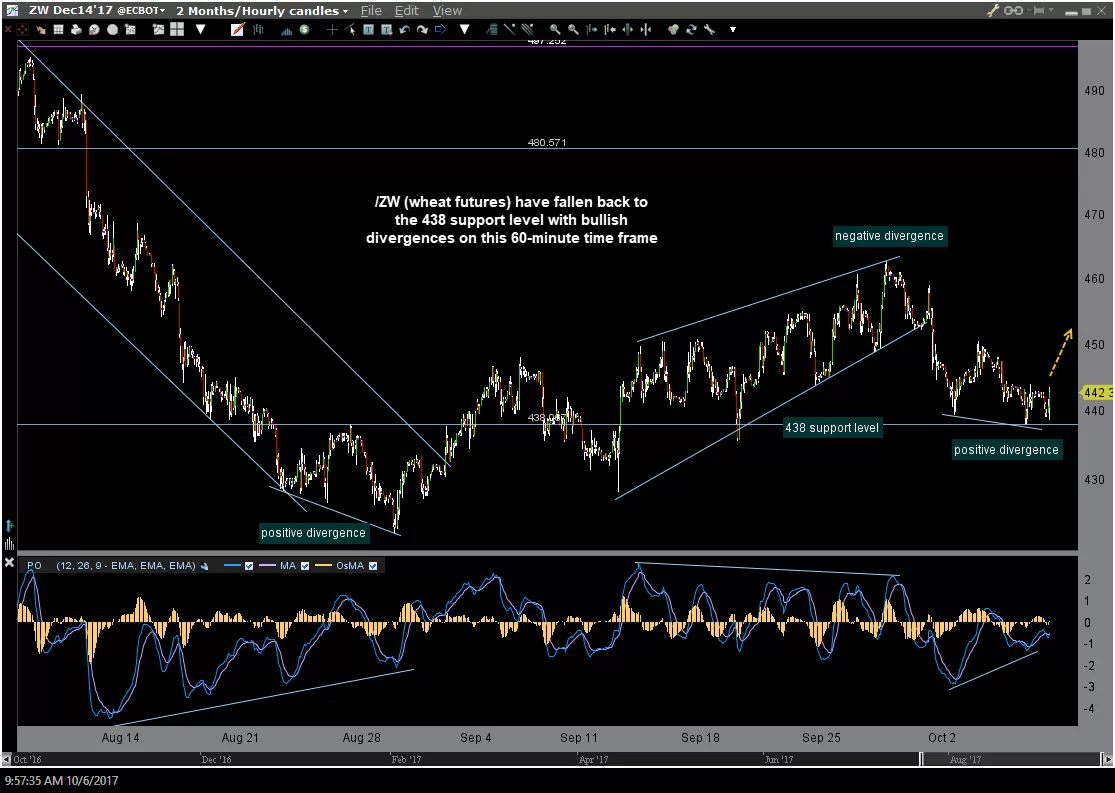
On the first chart below, /ZW (wheat futures) have fallen back to the 438 support level with bullish divergences on this 60-minute time frame. On the second chart below (daily chart of WEAT), the scenario with the green dotted arrow would be ideal for the Active Long Trade on WEAT with the white dotted lines outline an alternative scenario with WEAT making one more marginal new low with bullish divergences before a lasting trend reversal & rally. The suggest stop remains on any close below 6.40 (i.e.- 6.39 or below).
-
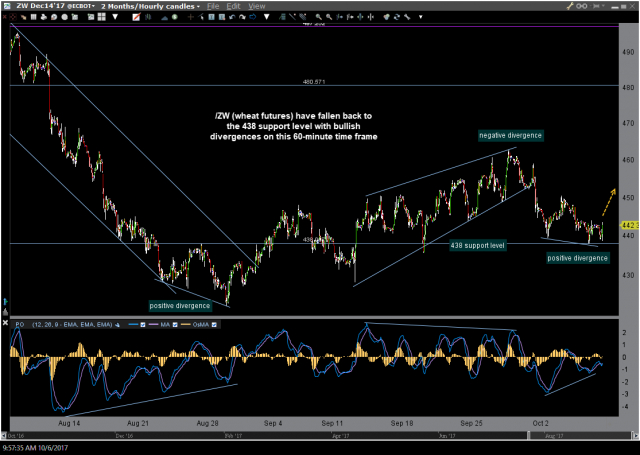
- ZW 60-min Oct 6th
-
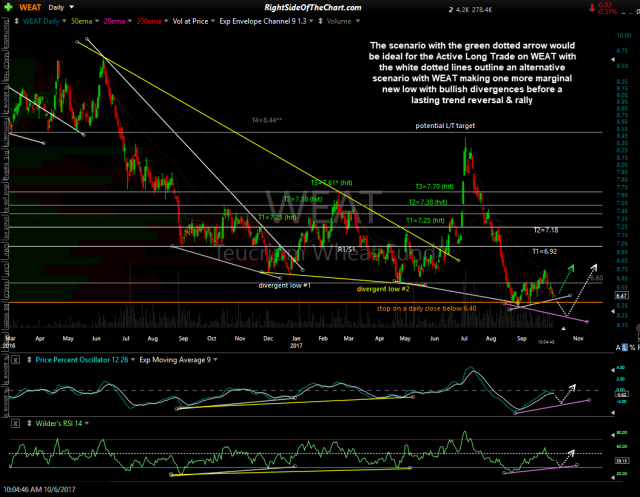
- WEAT daily Oct 6th