
WEAT (Wheat ETN) is approaching support on both this 60-minute time frame as well as the longer-term time frames with bullish divergences in place all the way out to the weekly charts. Watching to see if we get a reversal soon, even if prices briefly undercut this 60-minute support level.

WEAT 60-min Aug 15th
As agricultural commodity ETNs don’t do a perfect job of tracking prices of the underlying commodity, although most do a decent job of it, I like to confirm my analysis on the ETNs with the charts of the continuous futures contract. Looking at the daily & weekly charts of WEAT & $WHEAT, I can see a significant trend reversal anywhere from current levels to another 5-6% lower. As such, WEAT is on watch for another potential official trade idea, such as the last two successful long trades so far in 2017 as shown on this daily chart below.
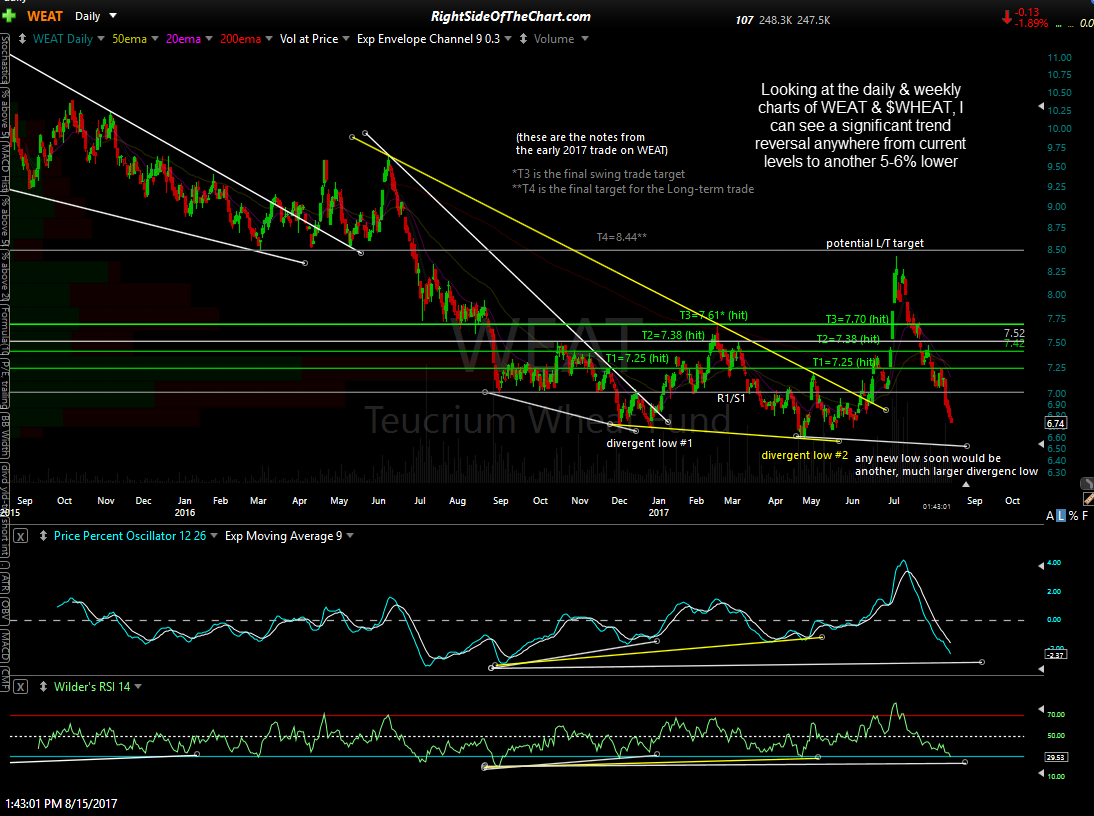
WEAT daily Aug 15th
The 20-year weekly chart of $WHEAT (wheat continuous futures contract) below shows several recent technical developments that support the case for a meaningful trend reversal in wheat prices. Back in late 2016 $WHEAT fell to a long-term trendline generated off the late 1999 lows with bullish divergences on the RSI & MACD at the time. Wheat prices found support on the trendline & rallied from there, going on to breakout above the primary downtrend line & recently coming back in to backtest that trendline from above.
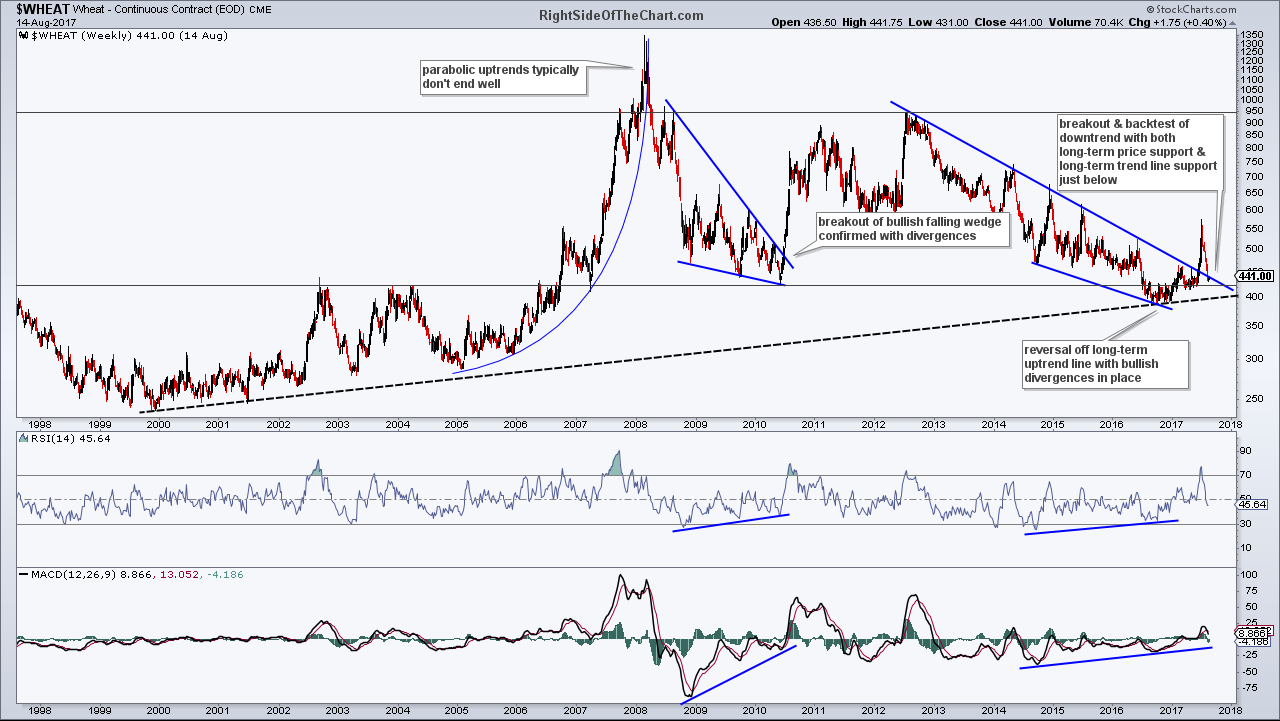
$WHEAT 20-year weekly Aug 15th
Trendlines often act as resistance when tested from below & support when tested from above. Should this backtest fail with wheat prices continuing to fall, $WHEAT has long-term price support around 424-425 just below with the long-term uptrend line just below that. With that trendline only about 5-6% below current levels, this certainly seems like an objective time to for long-term traders & investors to start scaling in to a long position in $Wheat via WEAT or futures contracts, for those experienced with the latter.
Should WEAT become an official trade setup and/or active trade, I will follow up with specific price targets but for those current long or considering a position, the overhead resistance levels on the 60-minute chart at the top of the page could serve as potential targets. Personally, I prefer to set my sell limit orders slightly below the actual resistance level(s) that I am targeting to minimize the chances of missing a fill if the trade happens to reverse just shy of resistance.