The bear trap/false breakdown scenario that I had laid out for /ZW (wheat futures) in recently videos as well as Monday’s update appears to be in play with /ZW recovering the 492 support level following a relatively brief breakdown below it. As I had stated in the recent updates, any break & marginal new low below 492 would still be a divergent low as both the PPO & RSI were clearly making higher highs while /ZW was testing the 492 support level. Previous (July 22nd) & updated 60-minute charts below:
-
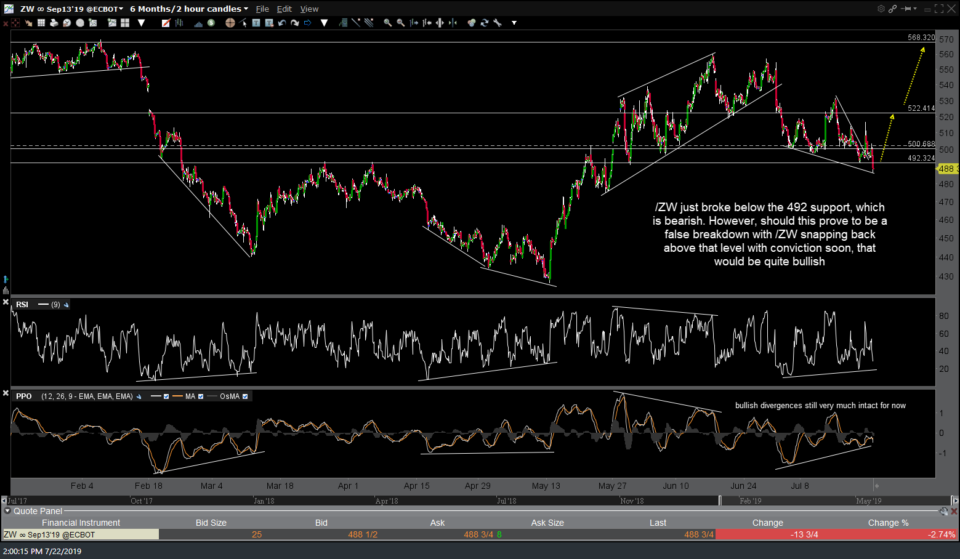
- ZW 60-min July 22nd

-
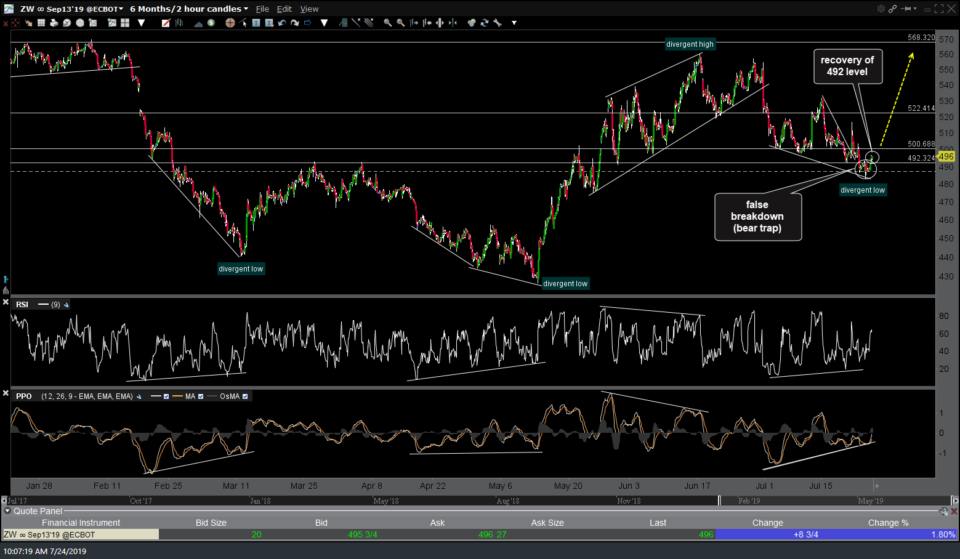
- ZW 60-min July 24th

This doesn’t guarantee that wheat will continue higher from here but it certainly increases the odds. I’m going to analyze the charts of /ZW & WEAT in order to identify some price targets for another official trade idea (following the last successful trade off the 2019 lows back in May which we caught the bulk of then exited before the recent correction), which I may add as soon as today, but I wanted to get these charts out to you asap for those that might want to take a starter position. WEAT 60-minute & $WHEAT (20+ yr long-term chart of wheat futures) below.
-
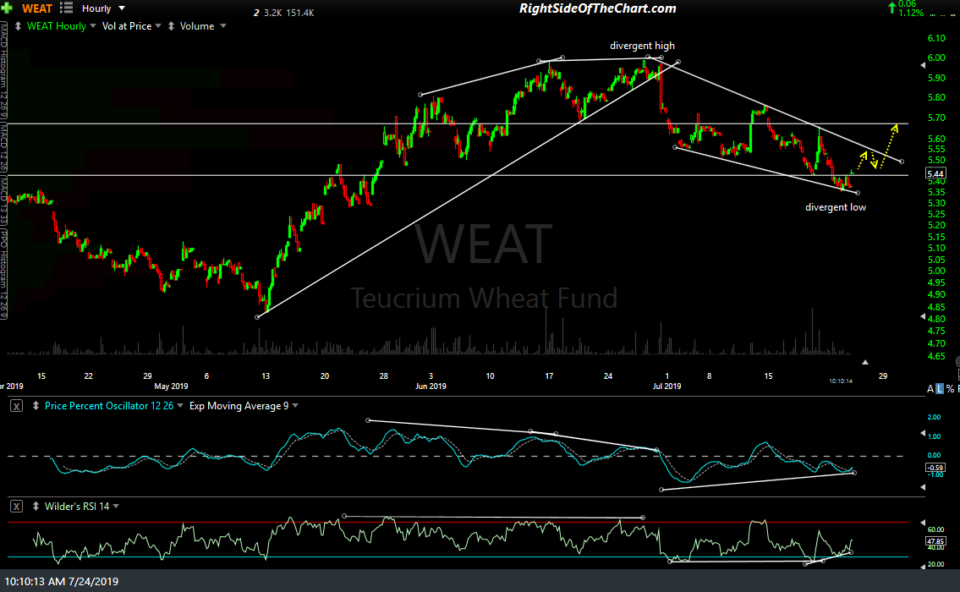
- WEAT 60-min July 24th

-
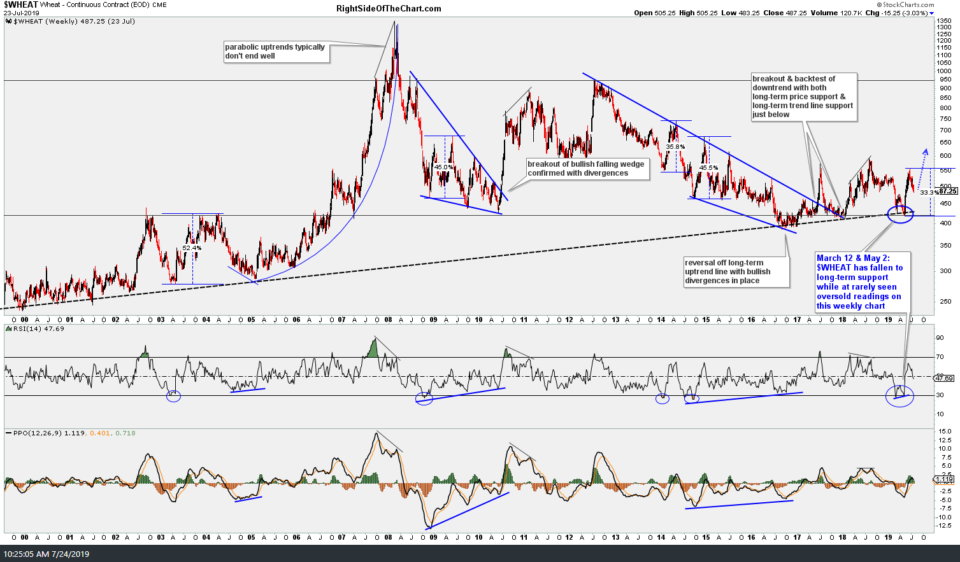
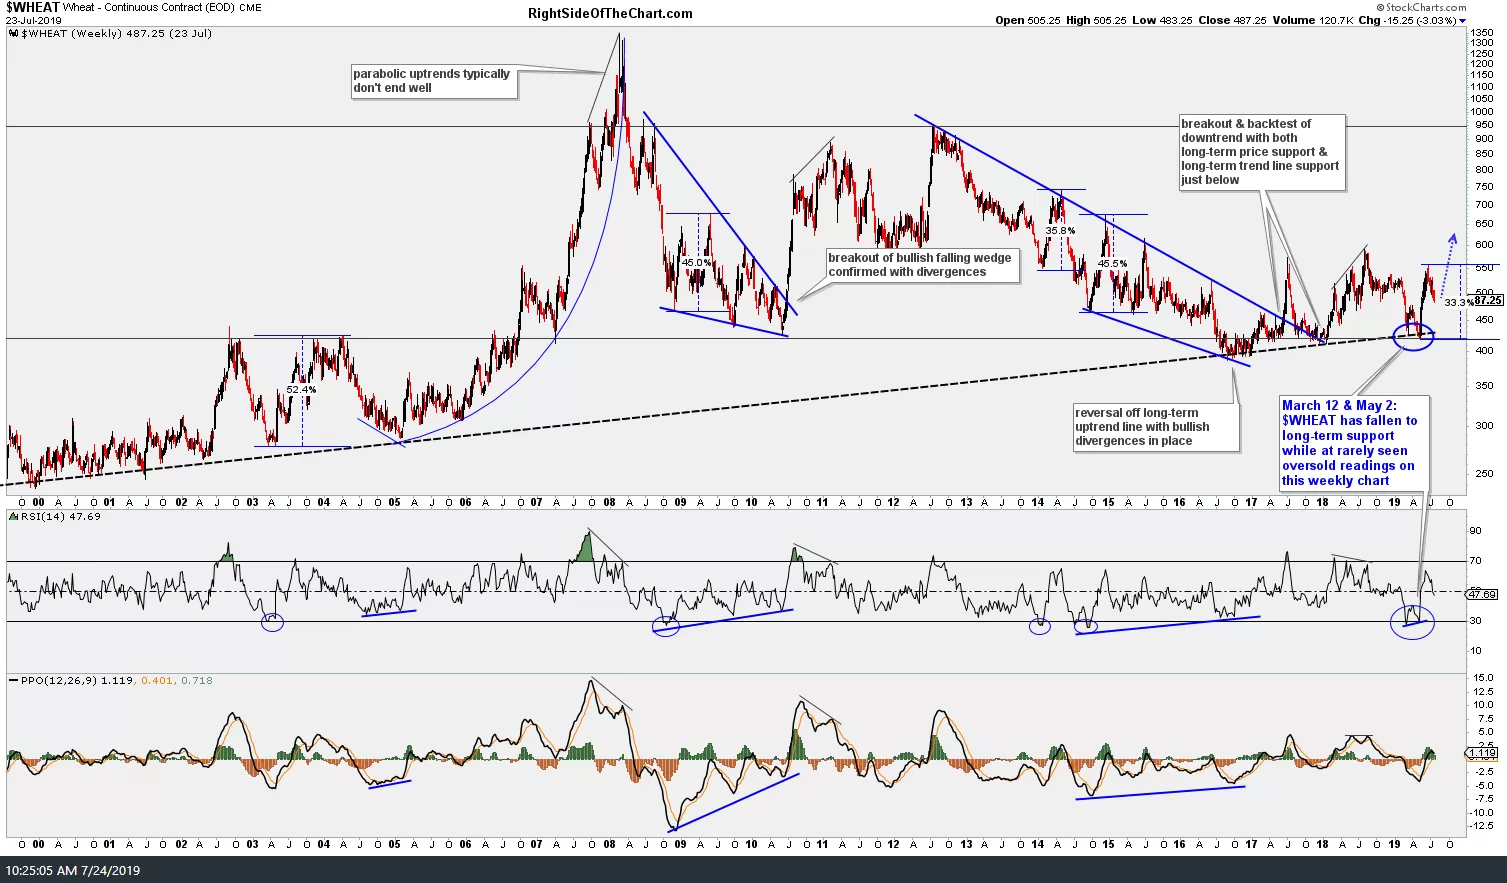
- $WHEAT weekly July 24th