
After hitting the final target for a 70% & reversing from there, VXX has pulled back to the former 1st target resistance level (now support) & offers an objective long entry. The previous charts from that last trade are posted below although I covered VXX hitting the final target the day of in the March 15th video (click here to view that segment of the video) and didn’t get around to posting a static chart after that.
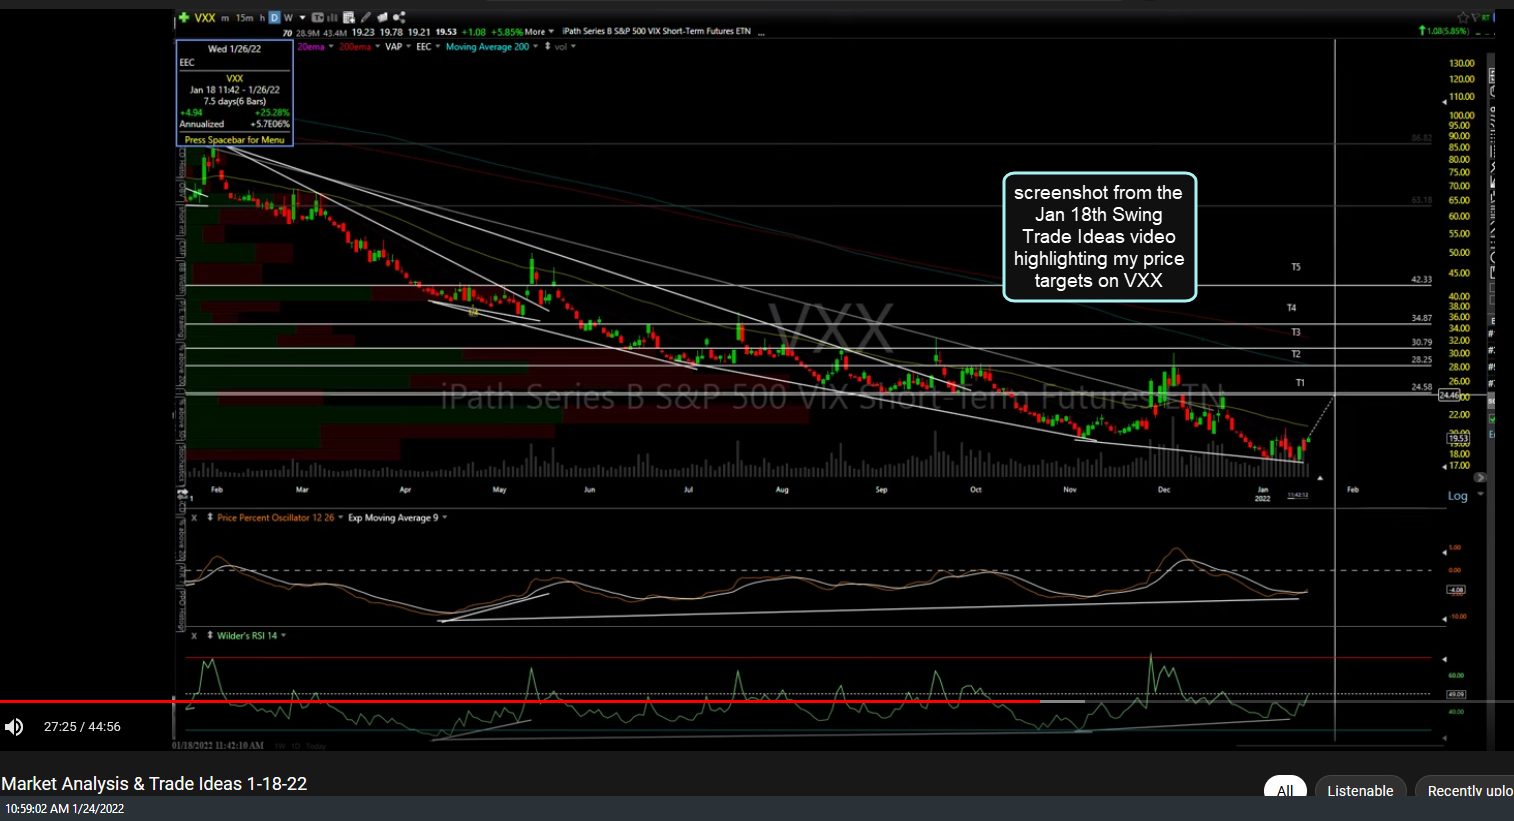
VXX screenshot Jan 18th video
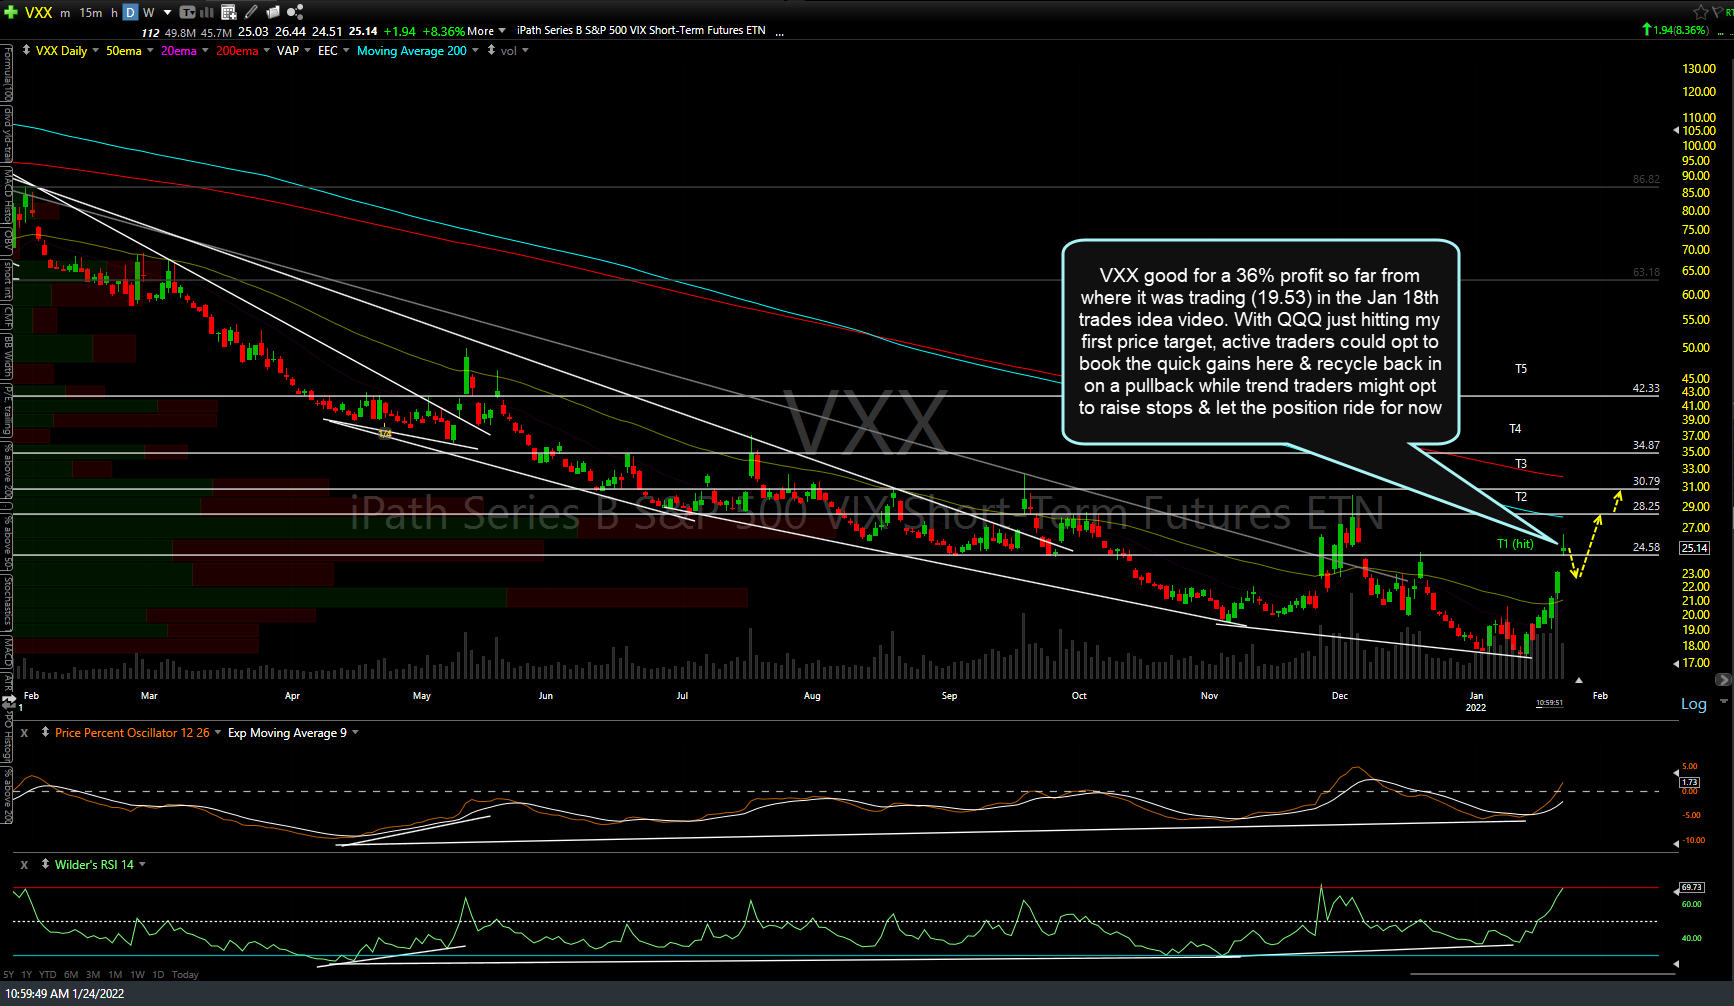
VXX daily Jan 24th

VXX daily March 2nd
The updated daily chart of VXX, along with the next price targets (in white), is below. At this time, T2 (slightly below the 34.87 support) is the final target a few additional potential targets that might be added, depending on how the charts of the major stock indices develop going forward. The suggested stop for this trade is any move below 22.00. This should be considered an aggressive, counter-trend trade with above-average gain & loss potential. As always, pass if this trade does not mesh with your outlook for the stock market, your risk tolerance, or your objectives.
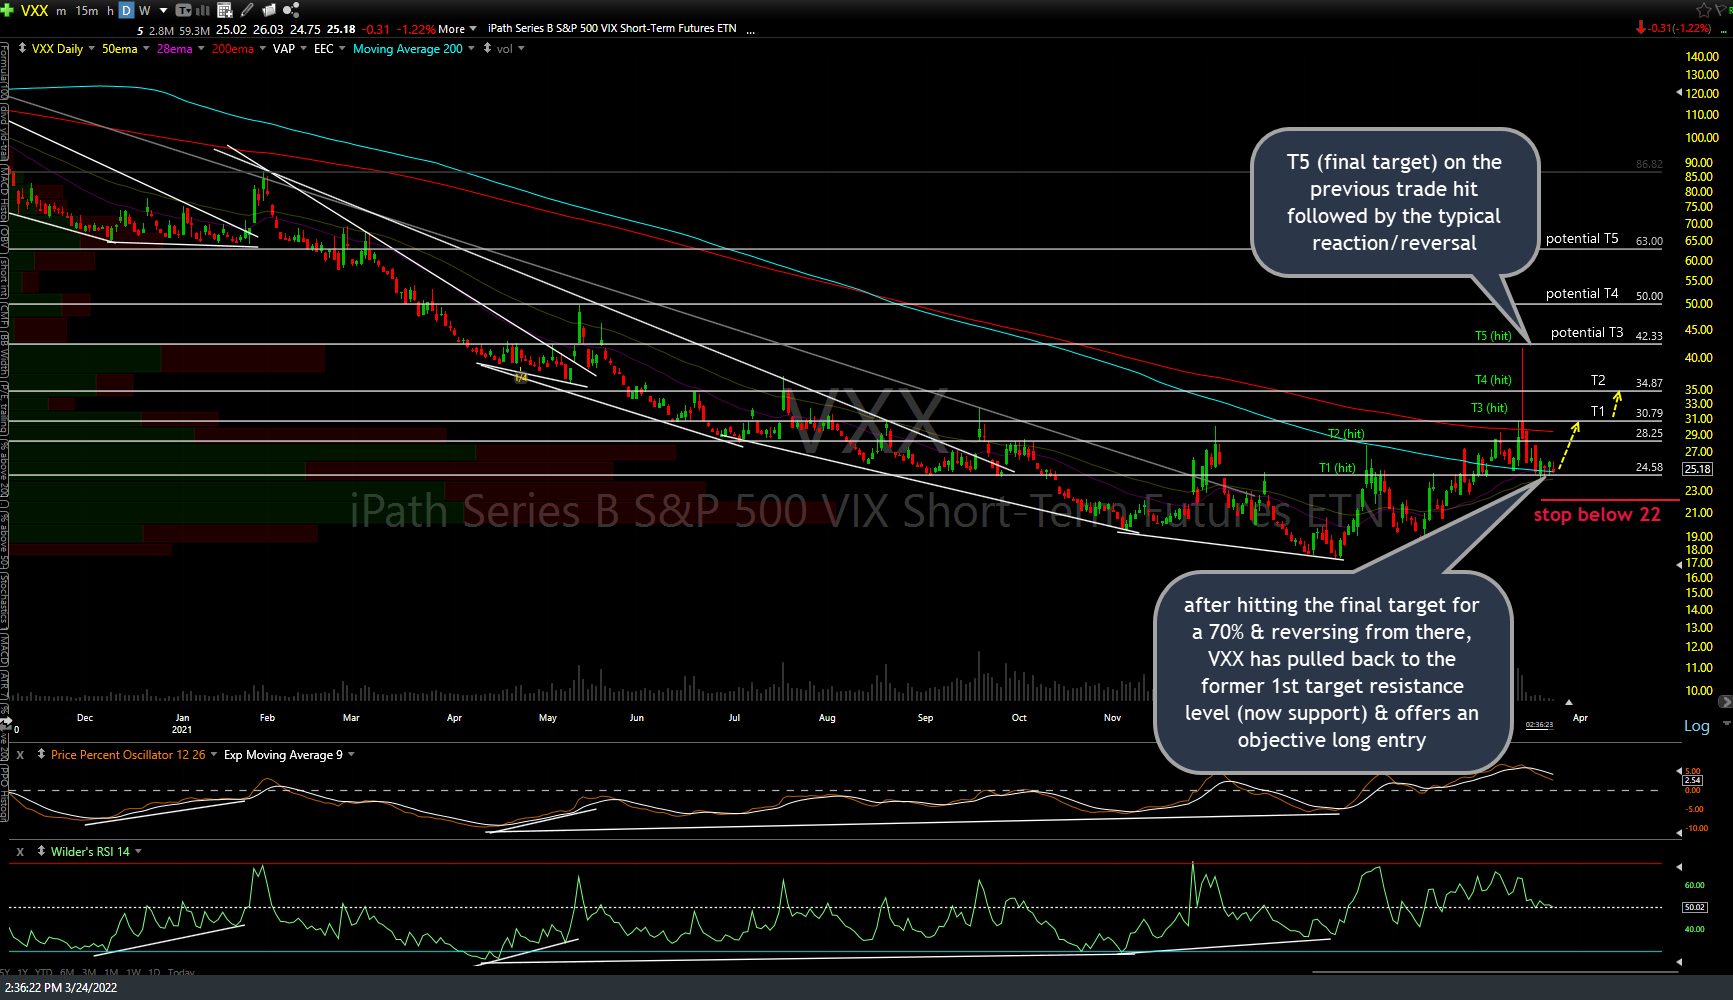
VXX daily March 24th