
Let’s see if I can keep up the hot streak of calling the $VIX volatility index & VIXY (short-term $VIX futures ETF) with precision & foresight that even the most sophisticated algos can’t come close to. Nobody bats .1000, at least not indefinitely but regardless, it looks like it might be time to tee up for the next pitch (the next leg up to my third & final price target on VIXY).
VIXY made a 4:1 reverse split on Nov 7, 2024 so the numbers below will reflect the split (x4) in parentheses.
The first chart below is the VIXY long trade posted back on July 11th, 2024. That entry was at 10.17 (40.68), with VIXY bottoming a low of 9.89 (39.56) literally the following day & going on to explode higher to hit my third price target, T3 at 22.24 (88.96) just 3 weeks later for a 120%+ profit.
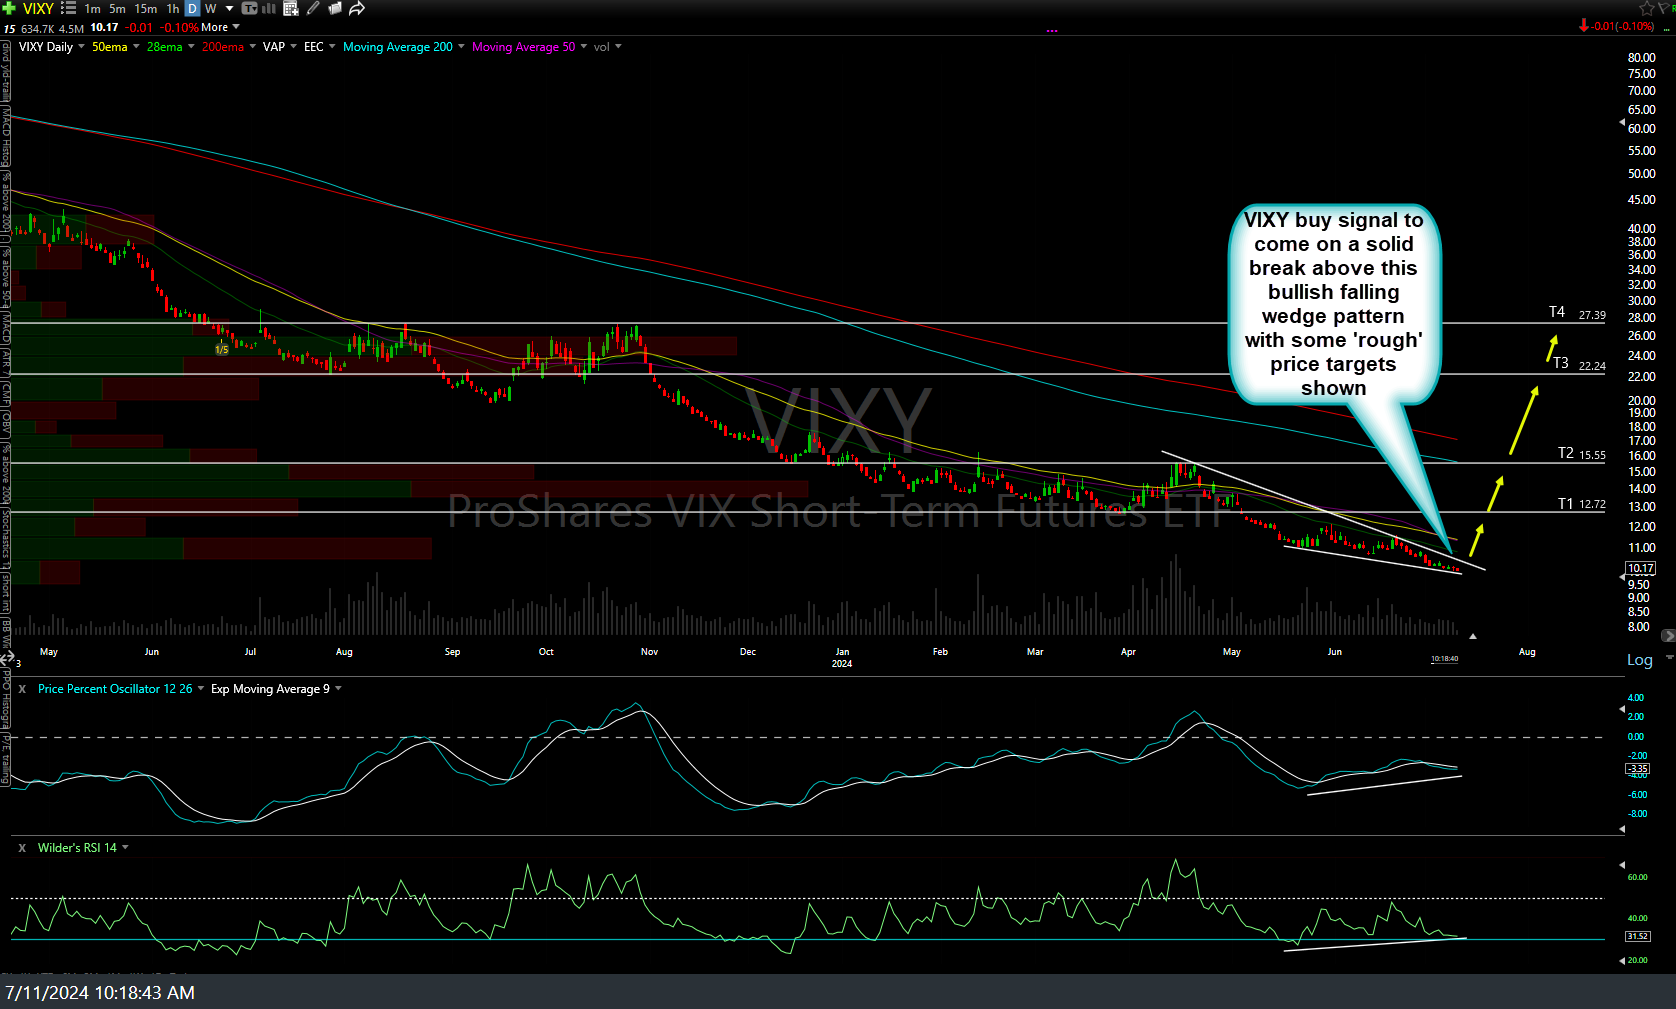
VIXY daily July 11th
As you can see from that July 11th chart (which was also when QQQ & the stock market peaked), I had initial included a forth price target (T4). However, on the morning of Aug 5th (i.e.- the exact bottom in pre-market of the exact day that largest correction since the 2022 bear market had bottomed, followed by an immediate & power trend reversal), stated in this post: “I am covering all of the short positions in my long-term accounts & going to a full long position..” (and reiterated the hard reversal from short to long, including closing out that $VIX/VIXY position) when /NQ hit T6 in this follow-up post, again cited a “hard reversal” from short to fully long.
My point in linking to those previous posts is to clarify that the $VIX had hit the end of the run at T3 with the stock market likely to reverse trend & as such, the $VIX as well (a perfect exit/reversal on both the market & the $VIX). The daily charts (initial entry on Jan 30, 2025) and updated VIXY charts are below.

VIXY daily Jan 30th

VIXY daily May 30th
Only time will tell whether or not my next & final target (T3) on the VIXY trade will be hit or not. As previously stated (about a gazillion times recently), the odds of that happening will spike significantly if & only if QQQ & SPY both clearly fall back below their 200-day moving averages. Hence, still a lot of work to be done in order to state with a high degree of confidence that T3 will likely be hit, especially in the coming weeks or months. However, as the updated daily chart above shows, VIXY is currently trading at the bottom of the scale-back-in-zone that was provided after T2 was hit, along with uptrend line + S2 price support (50.26ish), thereby offering an objective entry or add-on.
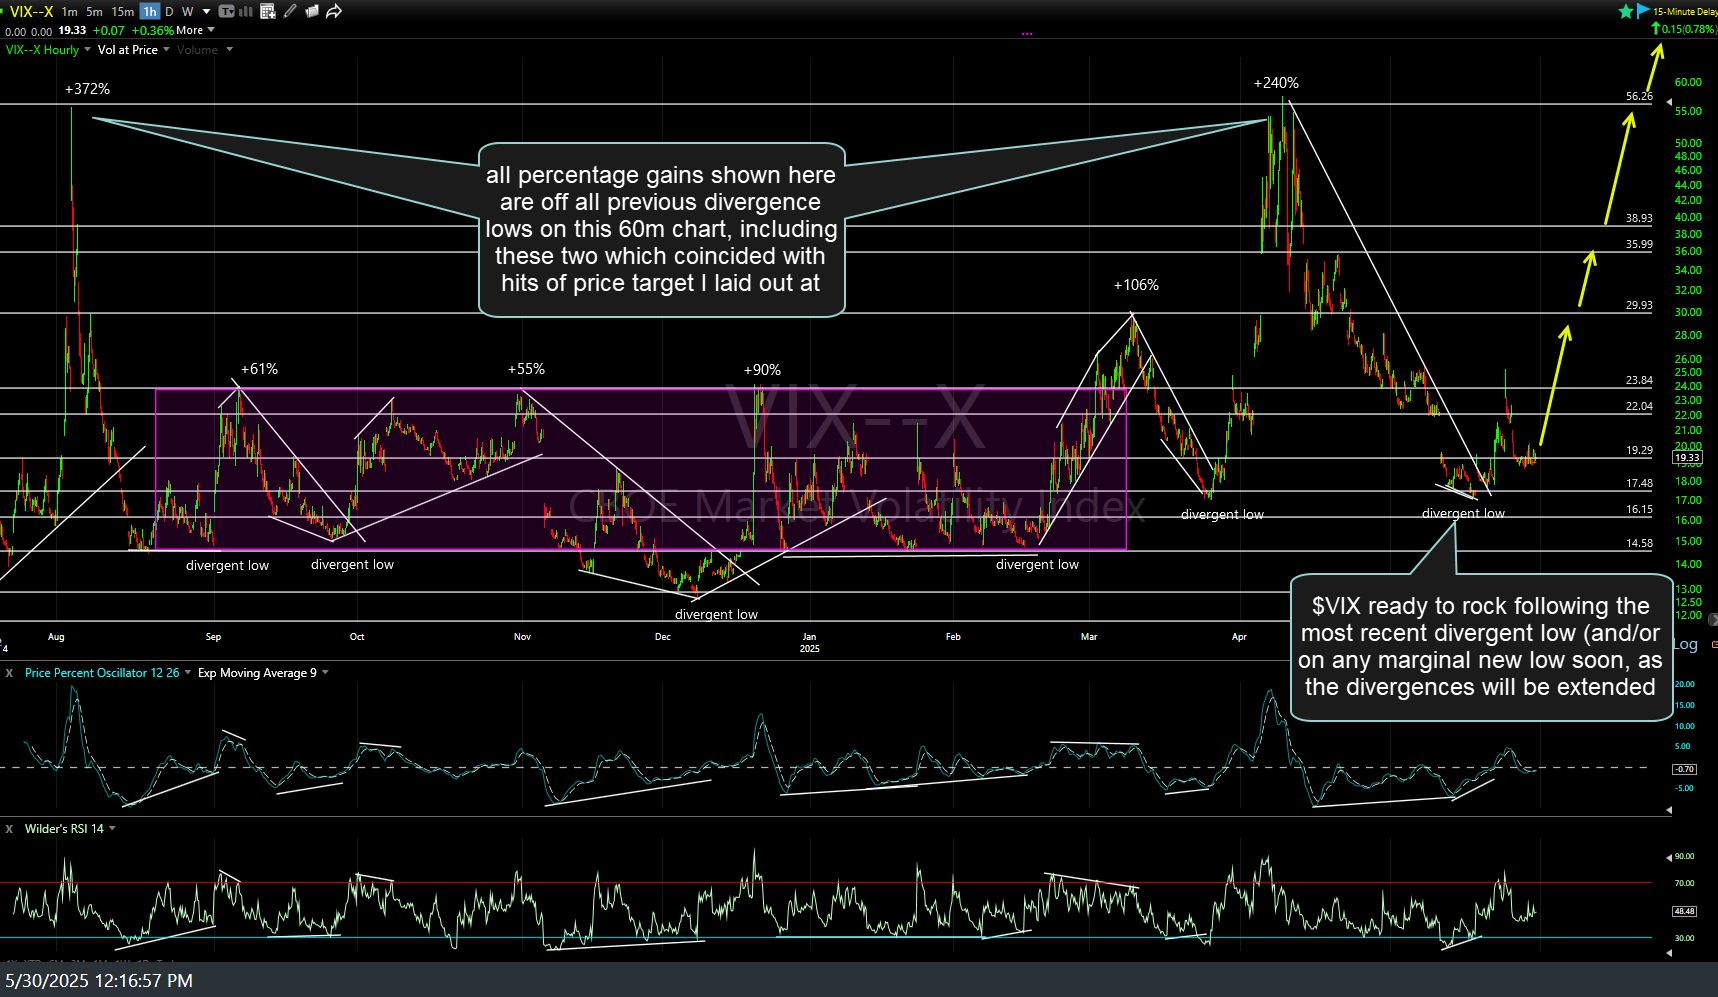
$VIX 60m May 30th
As the 60-minute chart above (and 120-minute below, in order to zoom out a bit further to include the July divergent low we positioned long on to game that 372% rally in the $VIX that followed) shows, all of the previous divergence lows on the 60-minute chart were followed by gains ranging from mid-to-high double digits to well into the triple digits. Additionally, the $VIX now appears ready to rock following the most recent divergent low (and/or on any marginal new low soon, as the divergences will be extended due to the current posture & strong divergence on the indicators.

$VIX 120m May 30th