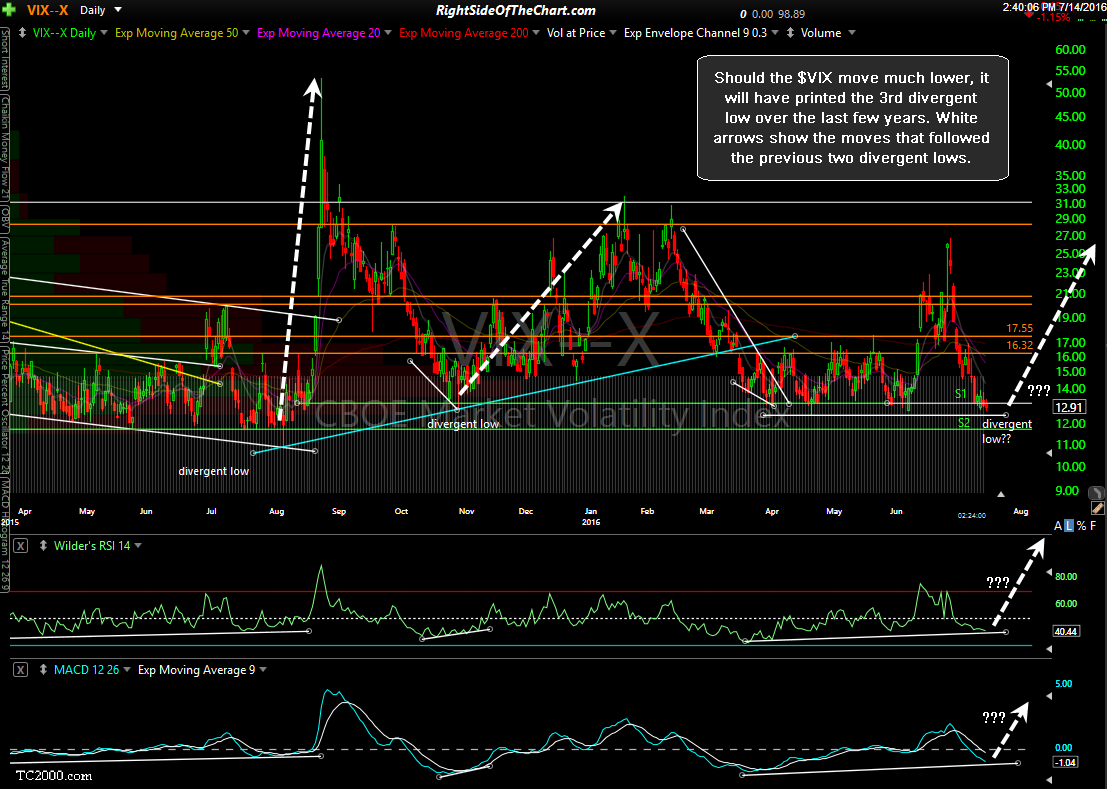
Should the $VIX (CBOE Market Volatility Index) move much lower, it will have printed the 3rd divergent low over the last few years. White arrows show the moves that followed the previous two divergent lows. As of today, the $VIX is challenging the June 7th reaction low, which immediately preceded the biggest jump in the $VIX (and associated market correction) since the previous divergent low & market correction that kicked off last October.
Should the $VIX fall much further, say to the S2 major support level around 11.80 & then reverse, that would most likely trigger a bullish crossover on the MACD, thereby confirming the third divergent low in years. On the flip side, the bullish scenario, which would be very likely if the stock market is headed much higher in the coming months, would be to see new lows on the $VIX with these potential divergences being negated by the MACD & RSI moving down below the March reaction lows. Something worth monitoring IMO.


