
Another sleepy, go-nowhere day in the stock market so really not much to update. However, I did want to reiterate that VIXY (short-term $VIX etf) still appears poised for the next leg up to my third & final price target with buy signals to come on a break above this triangle pattern on the 60-minute chart, and then the 54.55ish & 56.36ish resistance levels.
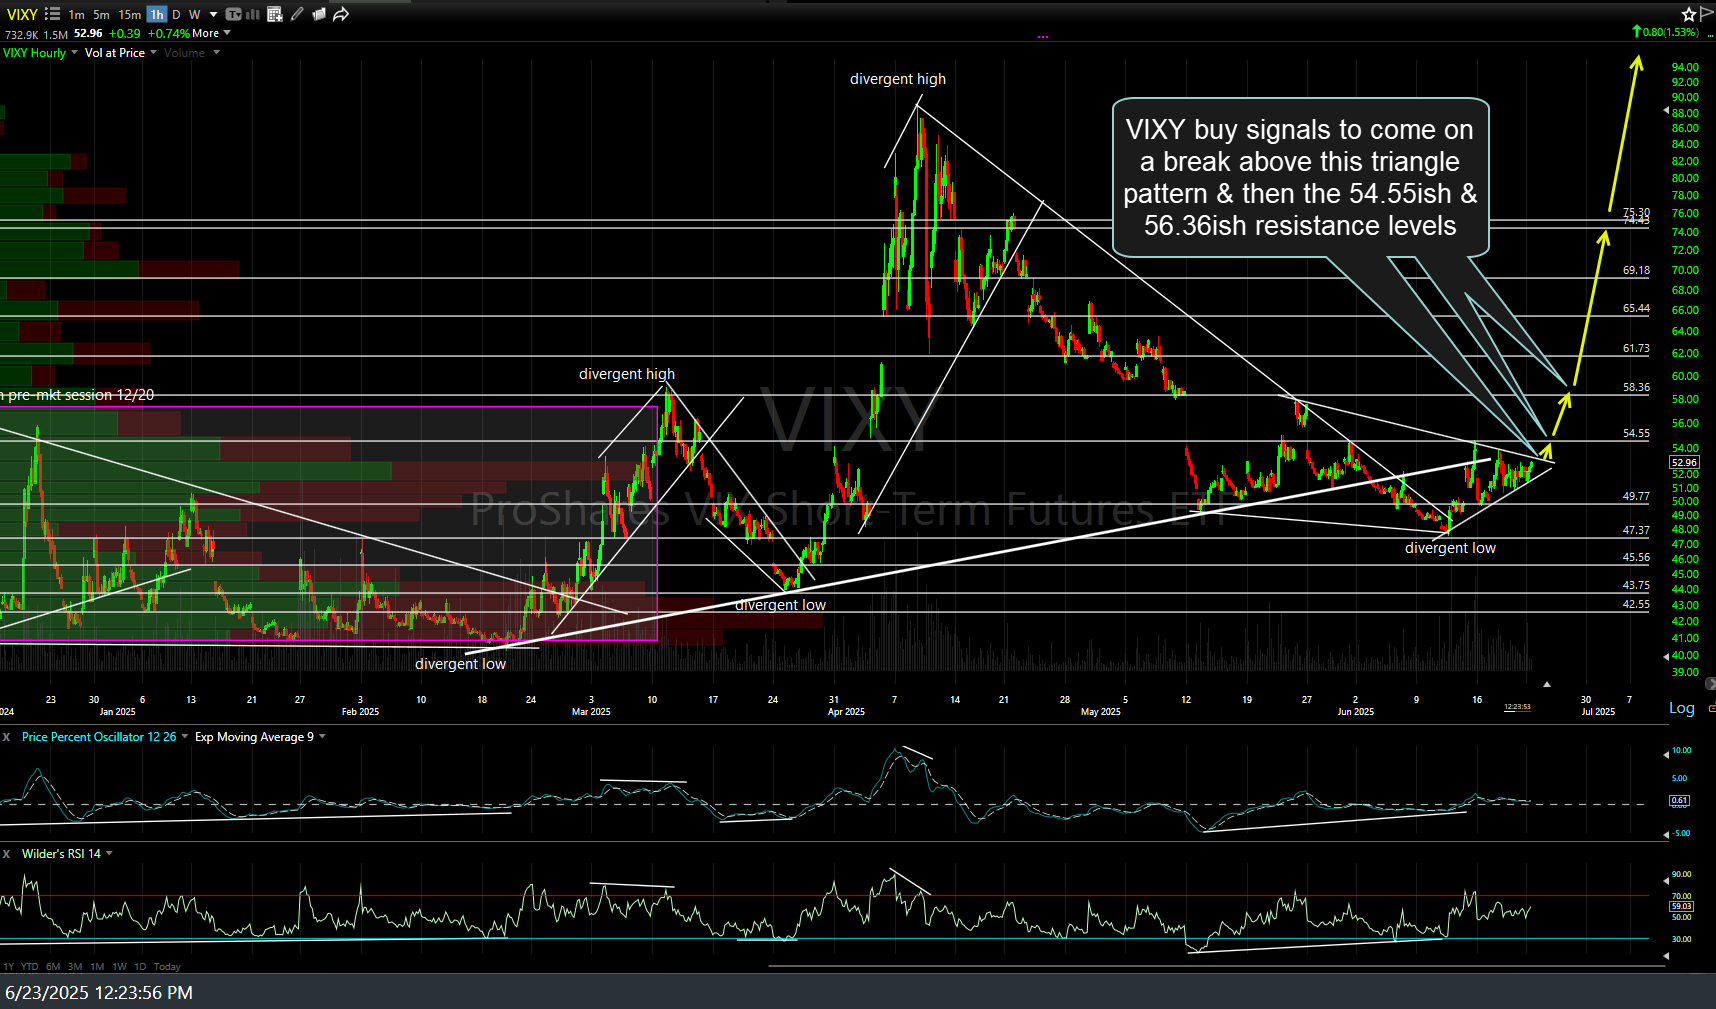
VIXY 60m June 23rd
When & if those three near-term resistance levels are taken out following this (expected) pullback off T2 (second price target on the daily chart), that should sharply increase the odds of a relatively swift & impulsive move up towards the final price target (T3). Initial (January 30th) & updated daily charts of VIXY below.

VIXY daily Jan 30th
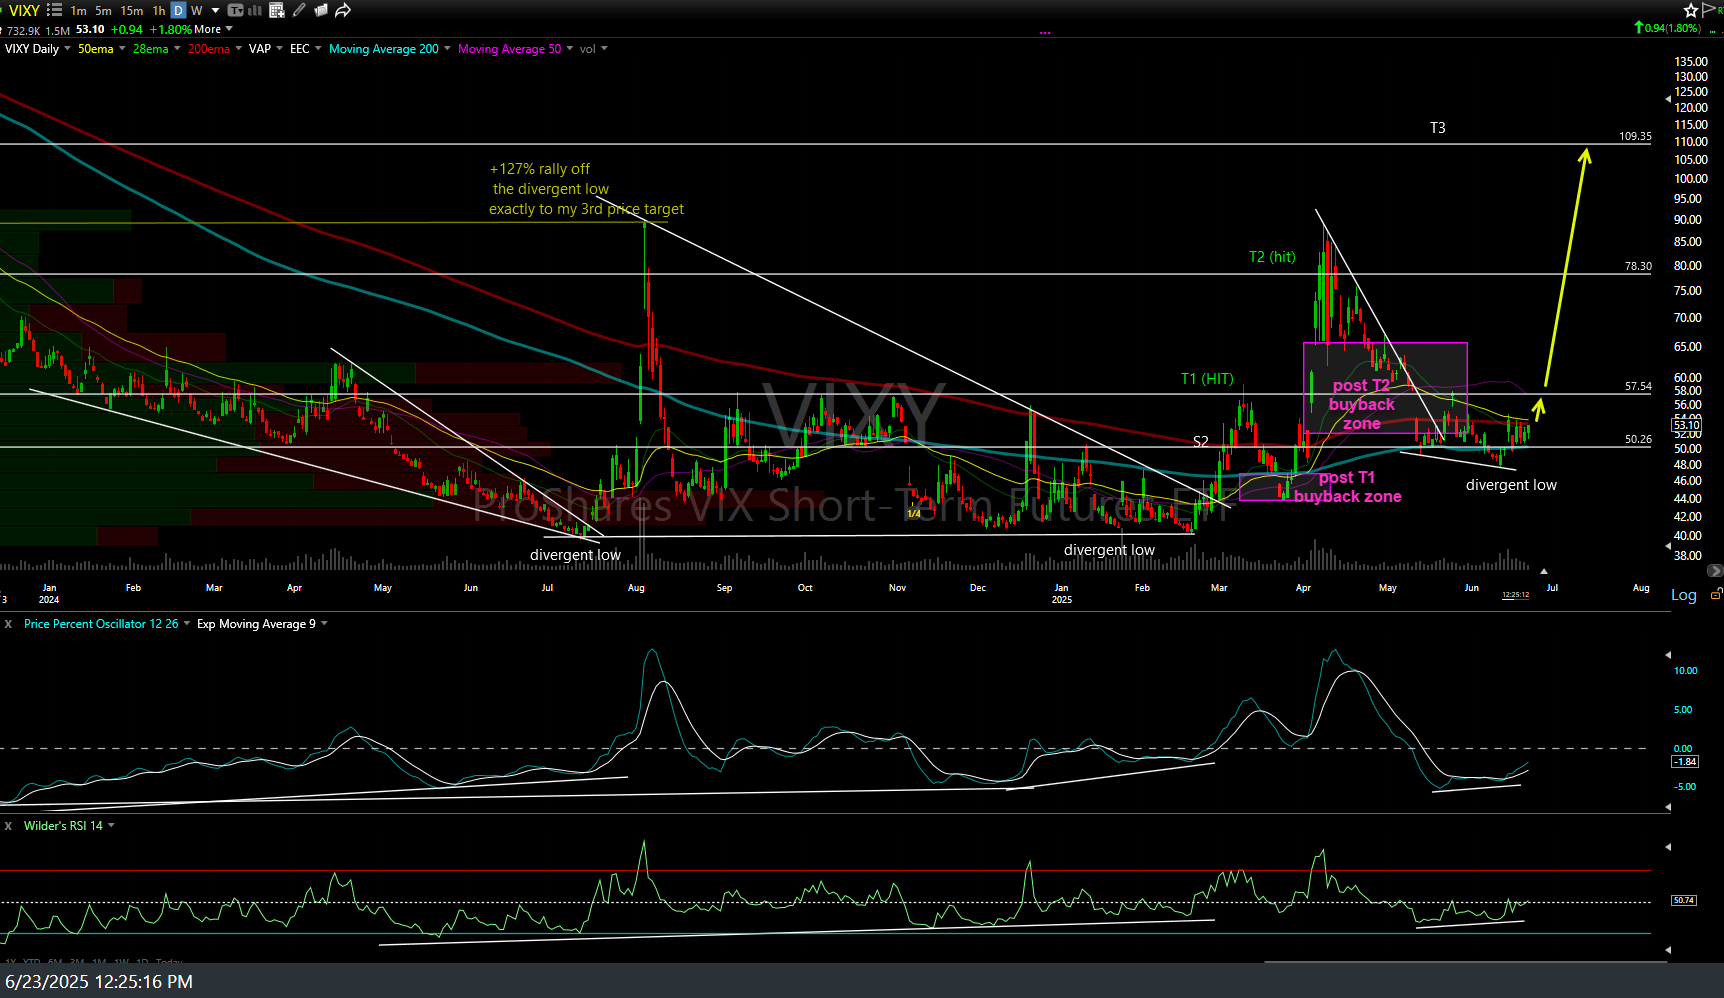
VIXY daily June 23rd
$VIX (spot $VIX volatility index) continues to climb following the pullback & reversal off my 16.15 support. Previous 120-minute (June 10th) & updated 60-minute charts below.
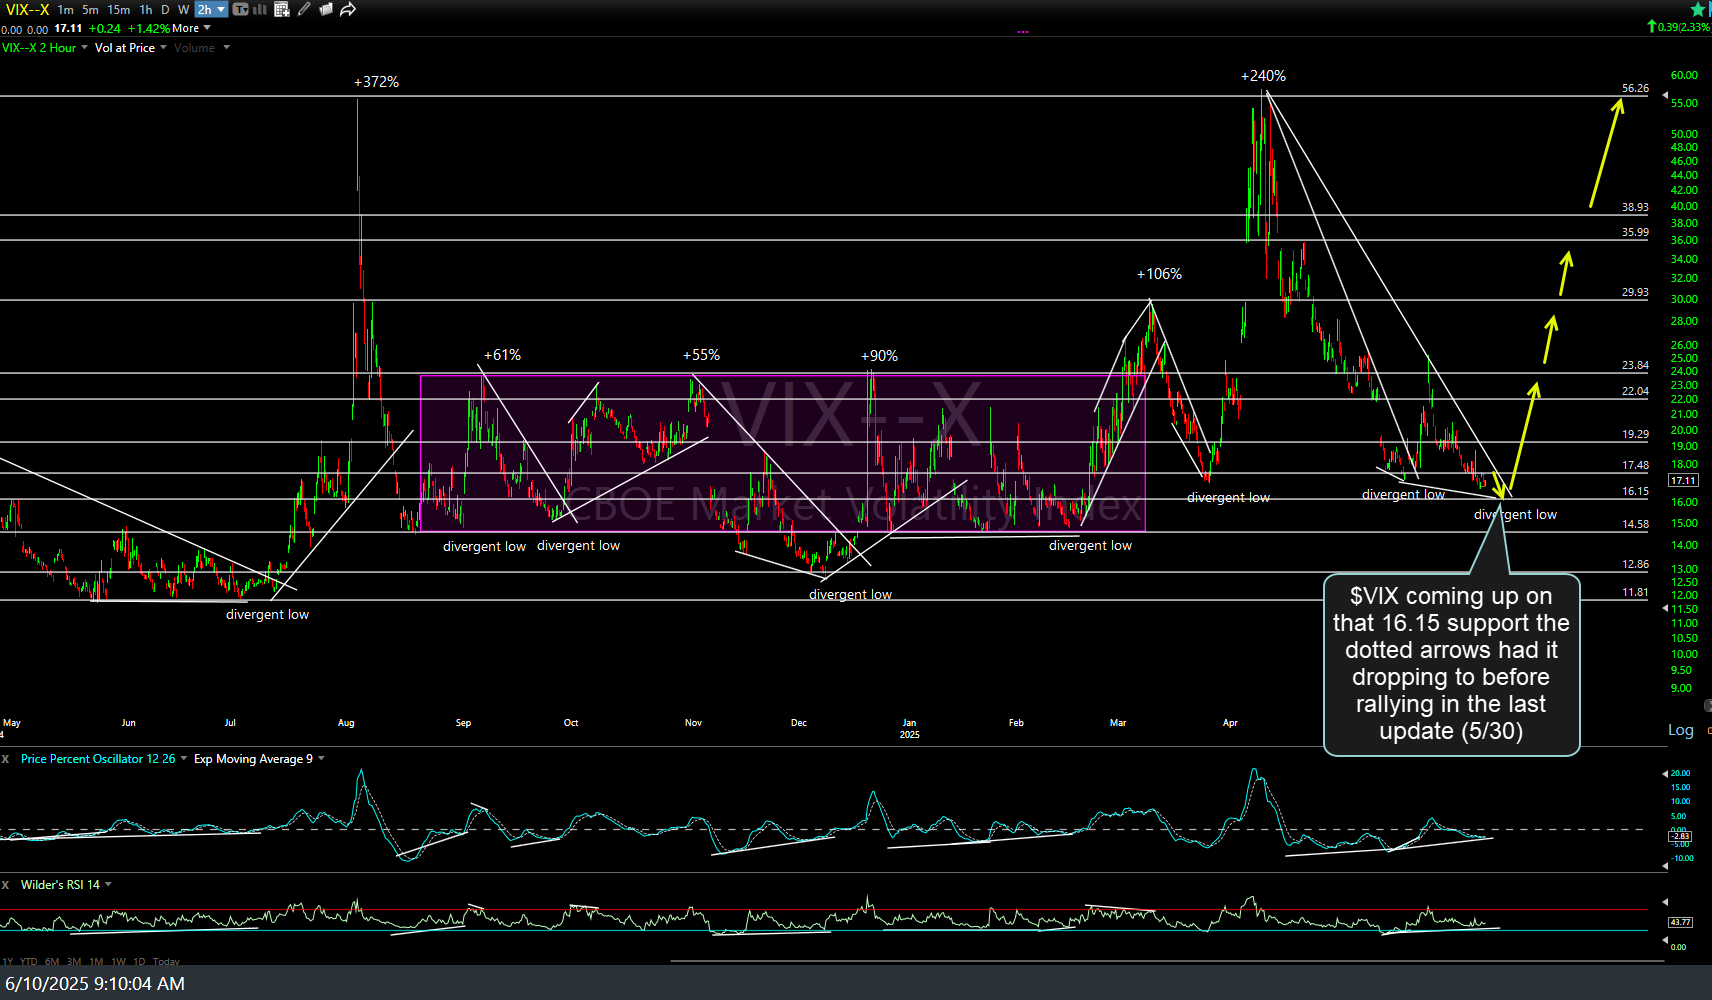
$VIX 120m June 10th
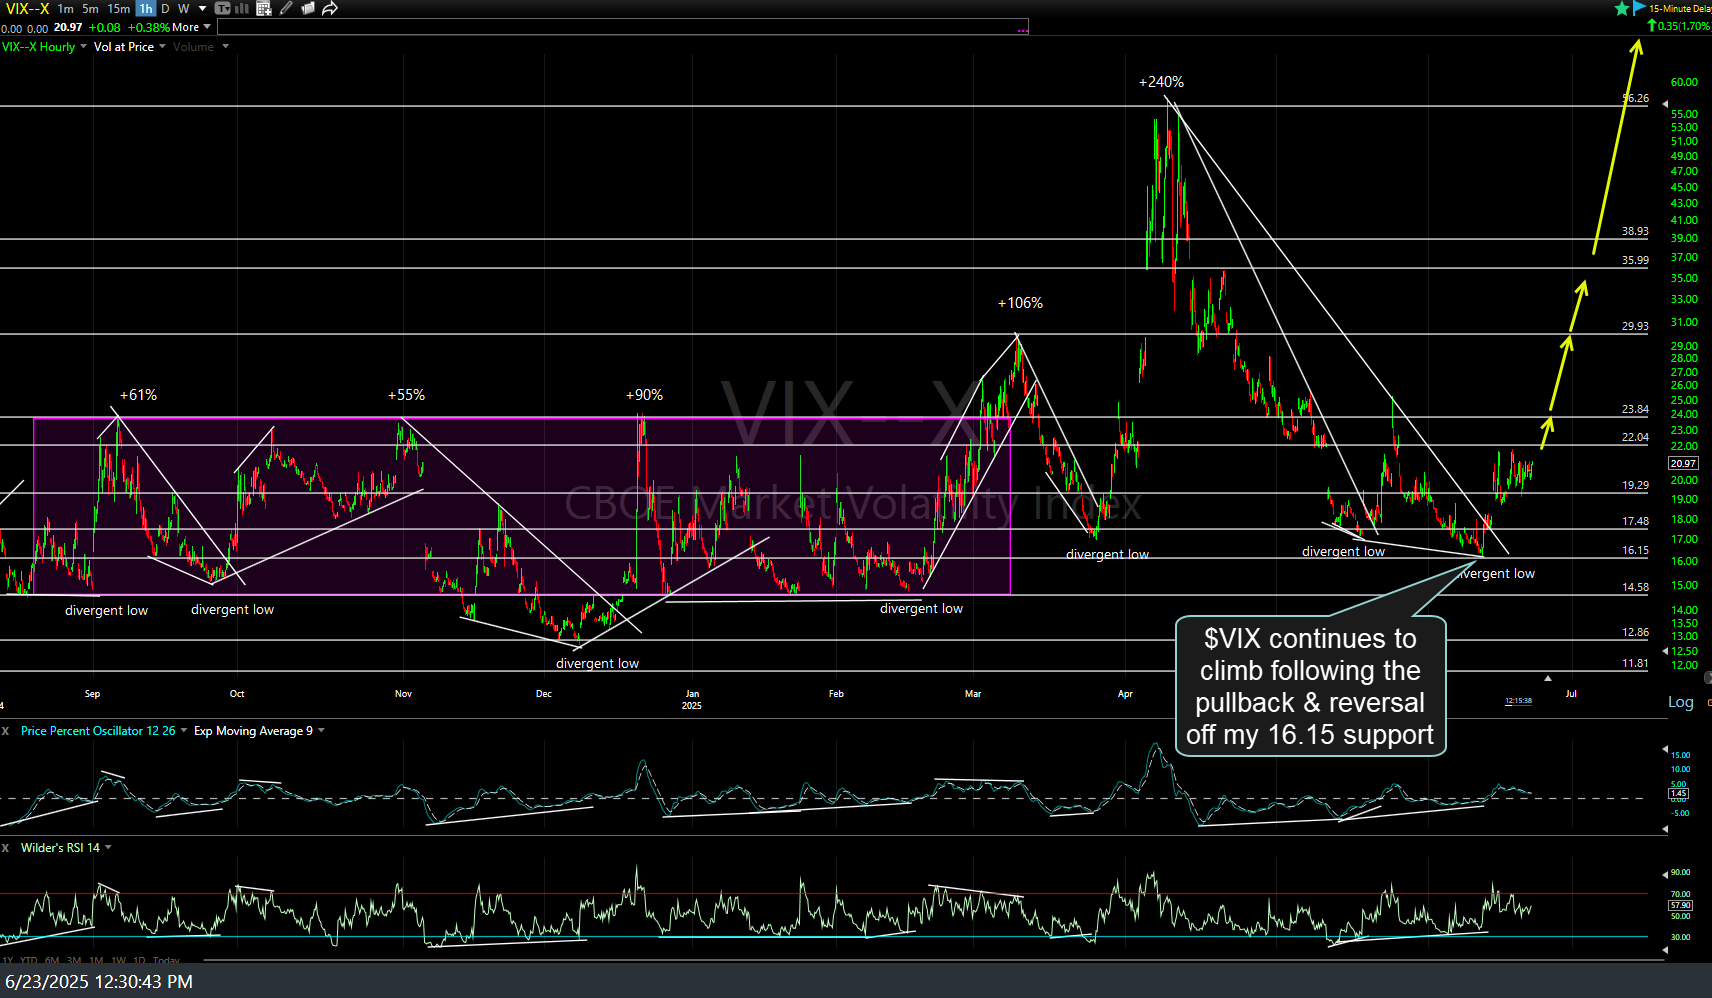
$VIX 60m June 23rd