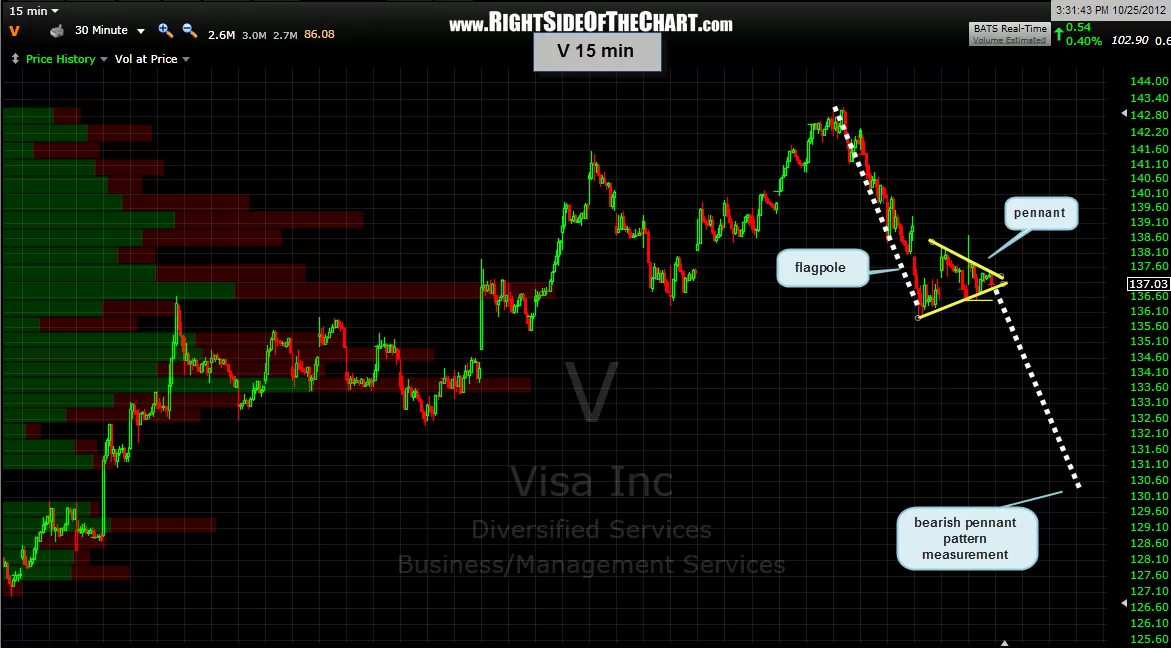
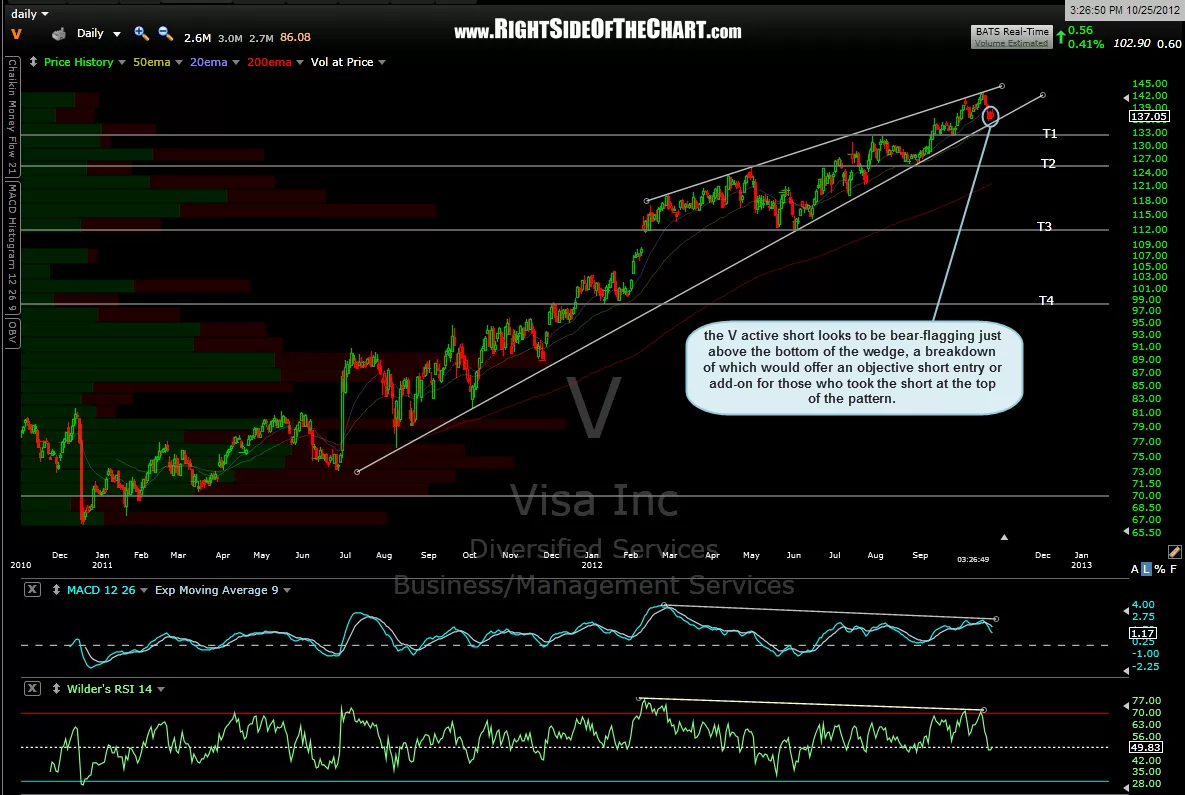
the V short, which was added as an active short trade recently at the top of this rising wedge pattern, has formed a nice looking bearish pennant the bottom of the wedge. i have highlighted the pattern on this updated daily chart although it shows more clearly on this 15 minute chart. keep in mind that a break down of this inherently bearish pattern on the shorter-term, intraday time frame would most like be the impetus for a more powerful, and lasting breakdown of the larger bearish rising wedge pattern on the daily chart. T3 is the preferred swing target as of now but that might be extended to T4, depending on how the broad markets and V trade over the next couple of months.

Results for {phrase} ({results_count} of {results_count_total})
Displaying {results_count} results of {results_count_total}