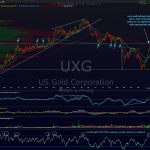
UXG looks like an objective short with a stop not too far above the marked resistance line. also note the history of pullbacks shortly after the RSI has reached overbought levels. there’s an uptrend line on the 60 min that a more conservative trader could wait to see breakdown before establishing a position. although sometimes i will do that, or wait to add to a full position when that happens, my style is often to short at or just below a well-defined resistance area if other factors seem to support a likely pullback in stock is imminent.
 edit: here’s an updated chart with targets…
NOTE: UXG changed it’s symbol to MUX shortly after these charts were made.


