
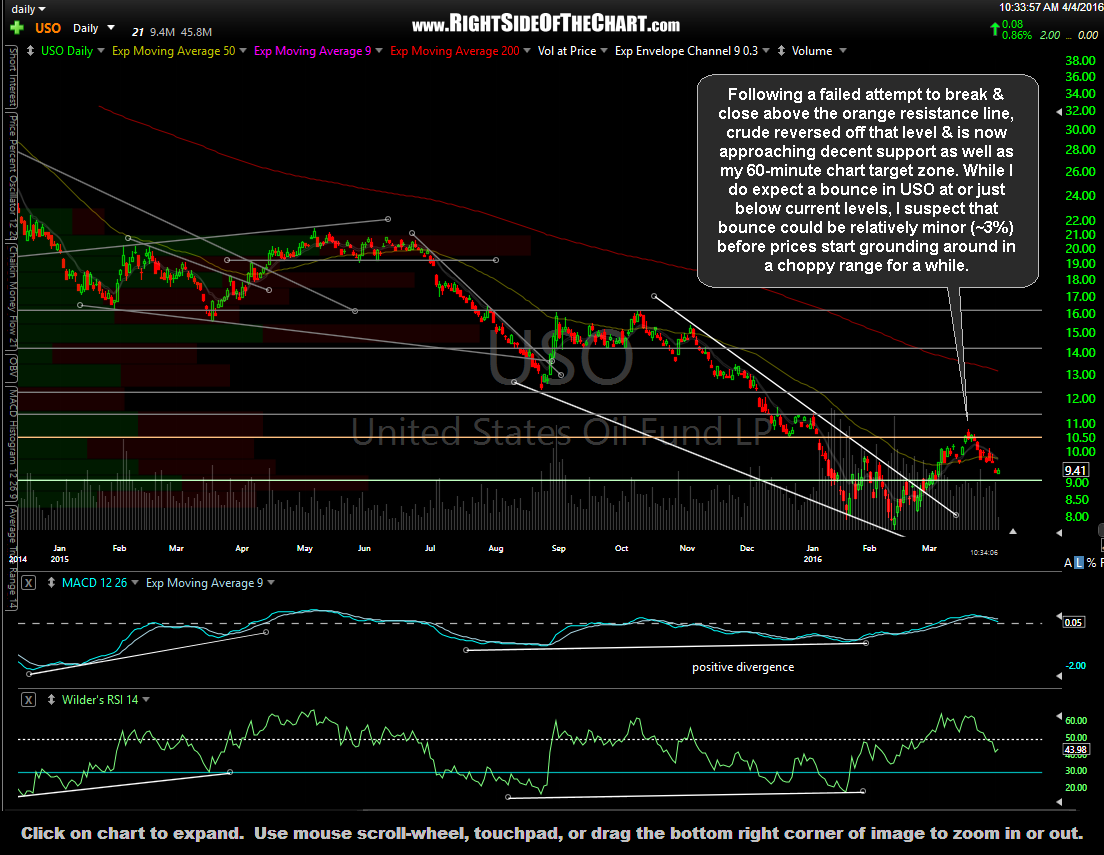
Following a failed attempt to break & close above the orange resistance line on the daily time frame, crude reversed off that level & is now approaching decent support as well as my 60-minute chart target zone. While I do expect a bounce in USO (crude oil etf) from or just below current levels, I suspect that bounce could be relatively minor (~3%) before prices start grounding around in a choppy range for a while. The previous daily charts of USO posted on March 11th & March 23rd are followed by today’s updated daily chart:
-

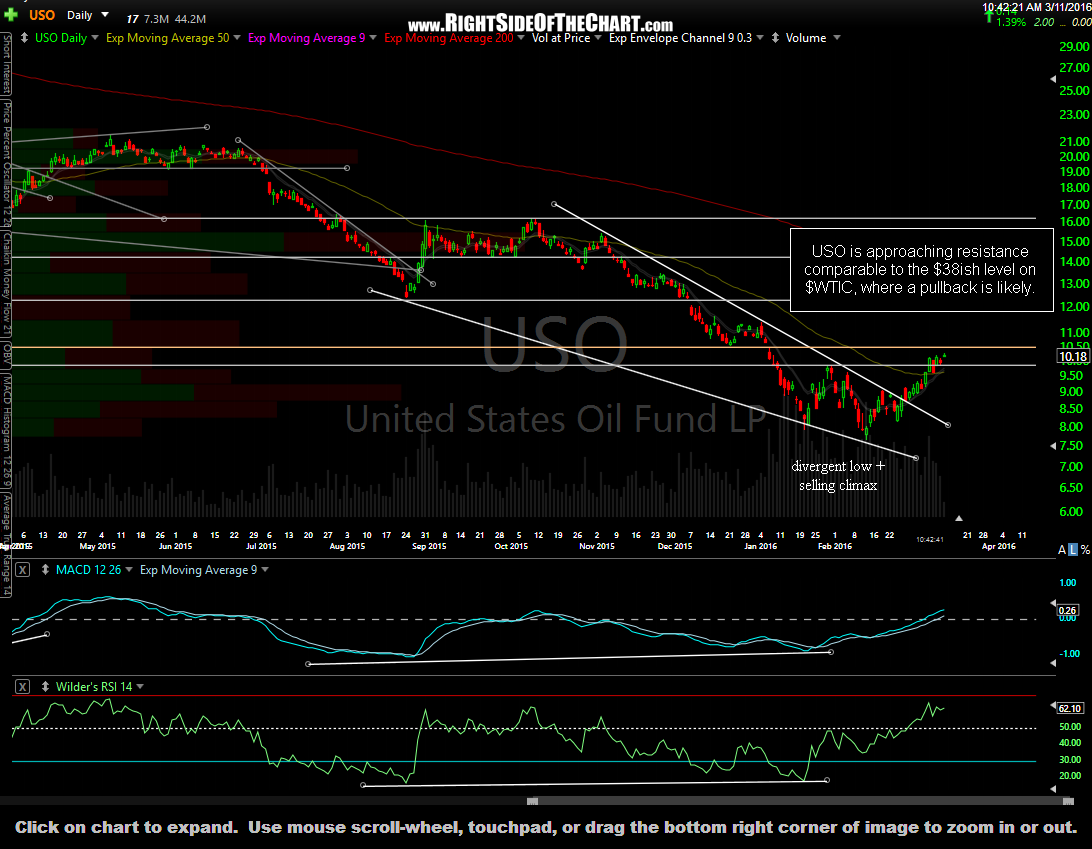
- USO daily March 11th
-
- USO daily March 23rd

-
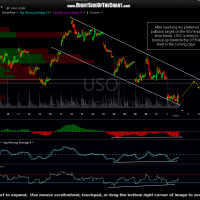
- USO daily April 4th
Zooming down to the intraday time frames we have the 60-minute chart from March 23rd & today’s 60-minute & 15-minute charts of USO. On the updated 60-minute chart, we can see that USO has now reached the mid-point of my preferred target zone, following confirmation of all the sell signals that I was looking for earlier. While a visit to the bottom of the zone is certainly a possibility, the R/R to remain short at this point is extremely unfavorable IMO. At the very least, consider lowering stops if short crude oil.
-
- USO 60-minute March 23rd
-
- USO 60-minute April 4th
-
- USO 15-minute April 4th
My opinion on crude isn’t strong enough to add it as an official trade idea just yet although I am keeping a close eye on crude & might post an unofficial short entry on DWTI in the trading room soon (as shorting DWTI should be profitable if crude bounces or even just trades in a sideways range for a few weeks+).