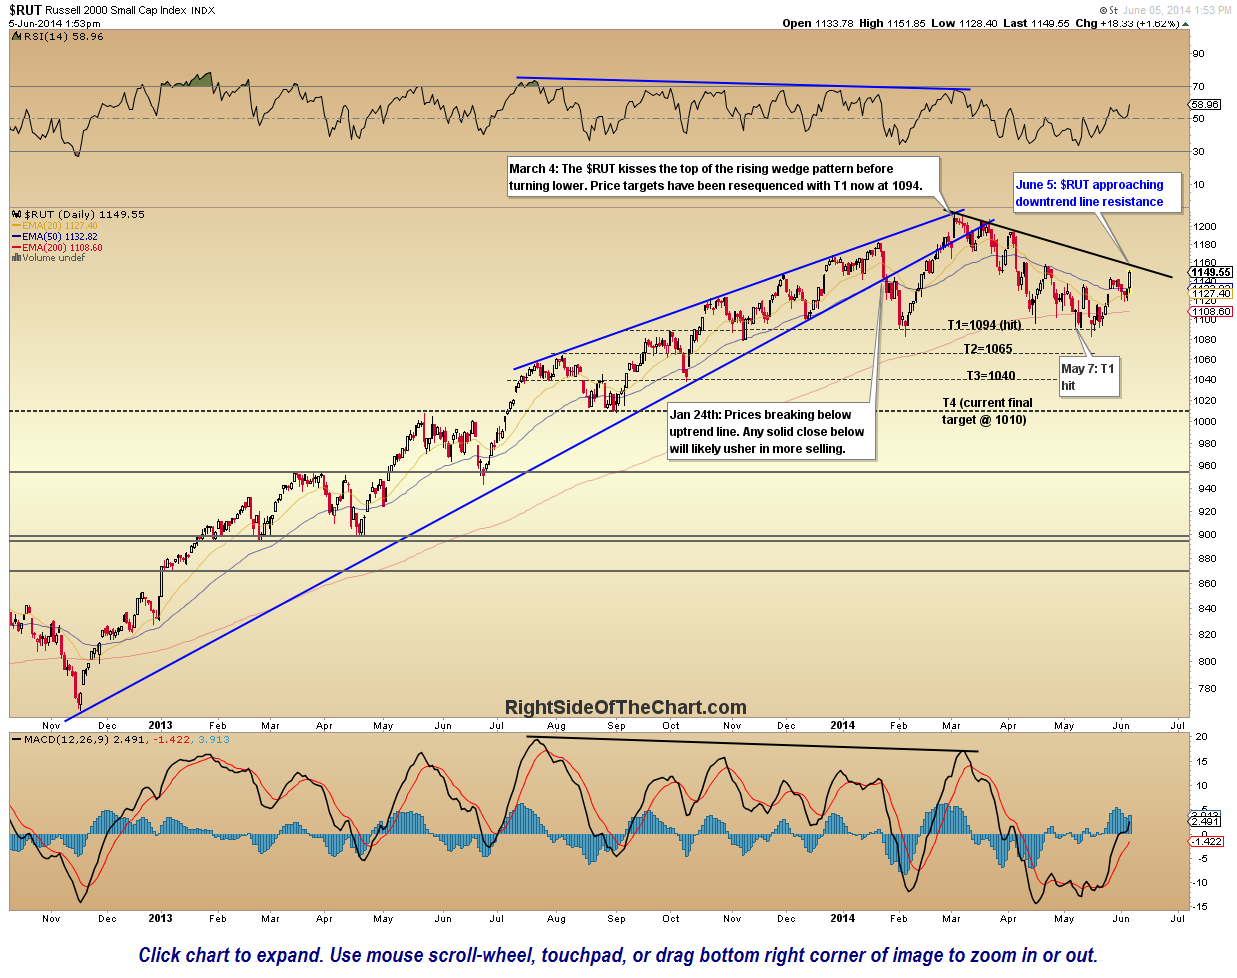
Still negative for the year, the Russell 2000 ($RUT) is approaching downtrend resistance while both the key 50 & 200 day moving averages (exponential) are virtually flat. Should the small caps make a solid break above this downtend line in the coming days, we would also be looking at a bullish crossover of the 20/50 ema pair, which has been on a sell signal since the bearish cross on April 11th. As of now, the short-term & long-term trend in the $RUT is bullish while the intermediate-term remains bearish by most metrics but again, any substantial upside from current levels will likely change that.
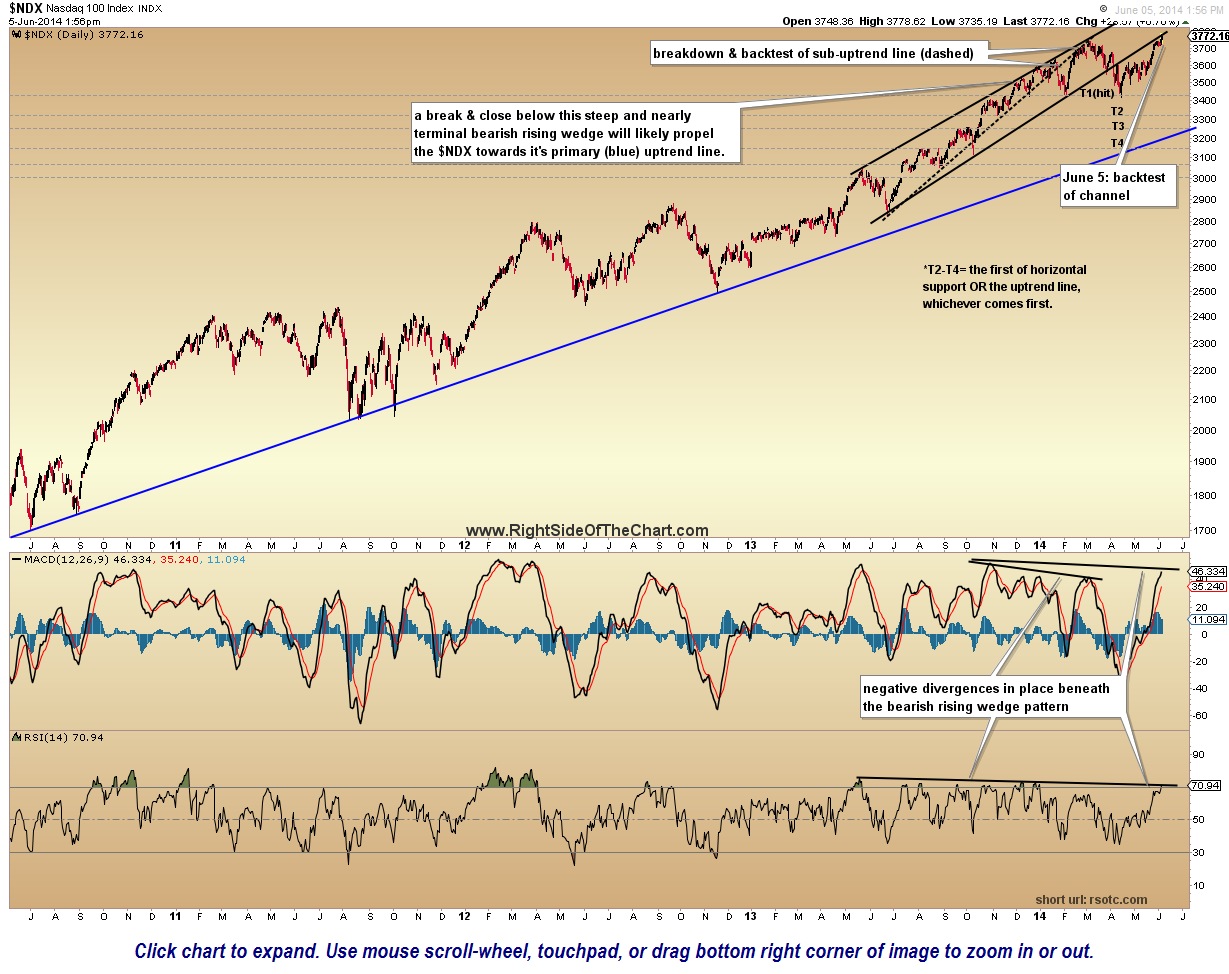
The Nasdaq 100 ($NDX) is up about 5% YTD with the Nasdaq Composite ($COMPQ) only up by about half that amount so far in 2014. All trends on the $NDX remain bullish at this time and although numerous bearish divergences persist, we don’t have any sell signals or a solid case to be short at this time, other than a speculative short here at resistance with a stop not far above.
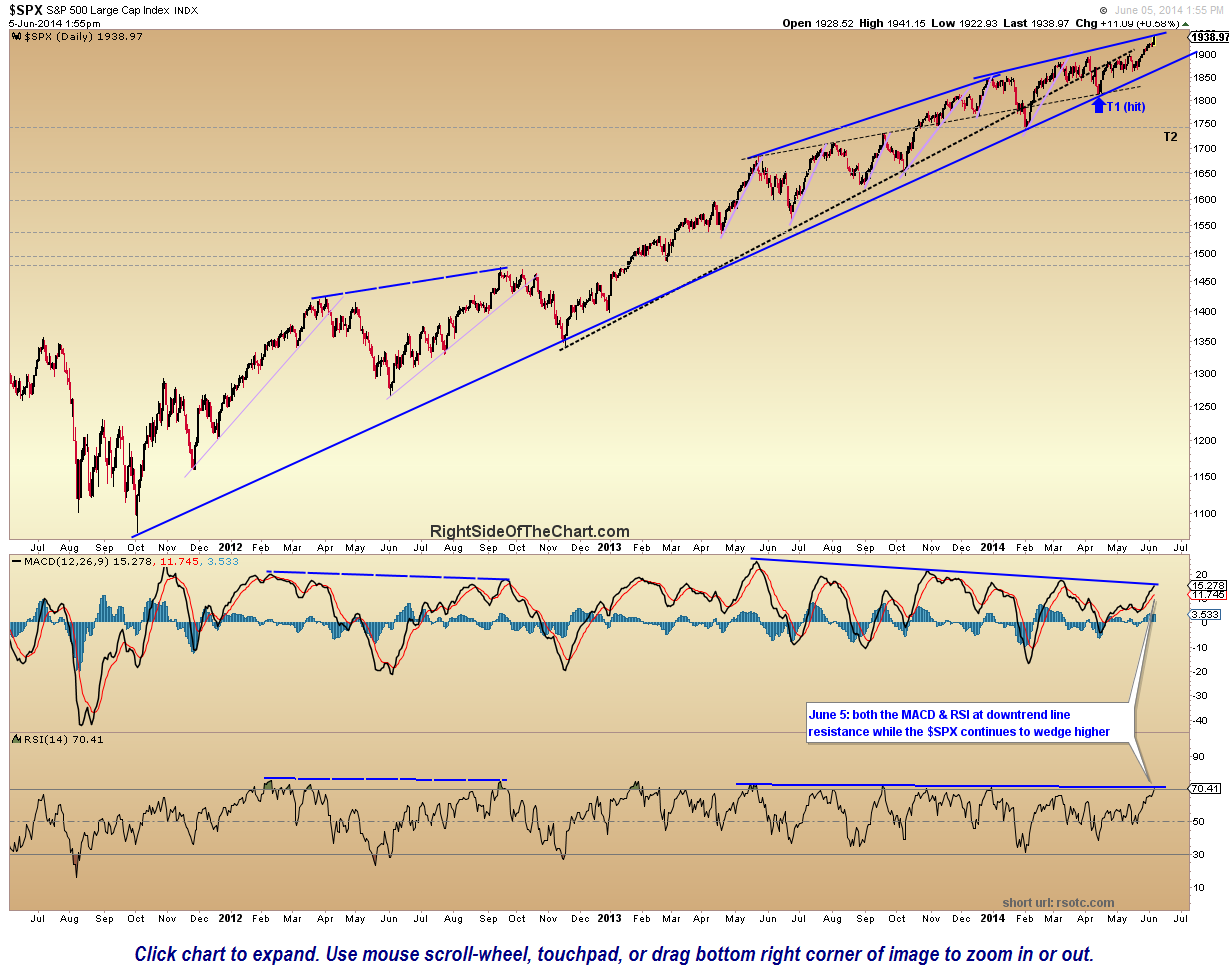
The S&P 500 ($SPX) is also trading up about a mere 5% on the year & although trading at new all-time highs today, the fact that the index continues to wedge higher while most price & momentum indicators and oscillators lag (i.e.- negative divergence) warns that the chances of a trend reversal continue to remain elevated at this time. Of course divergences can be negated should the indicators start to make higher highs along with price. In fact, as of today, both the MACD & RSI are challenging the downtrend lines which have acted as resistance (and defined the divergence against price) for just over a year now.
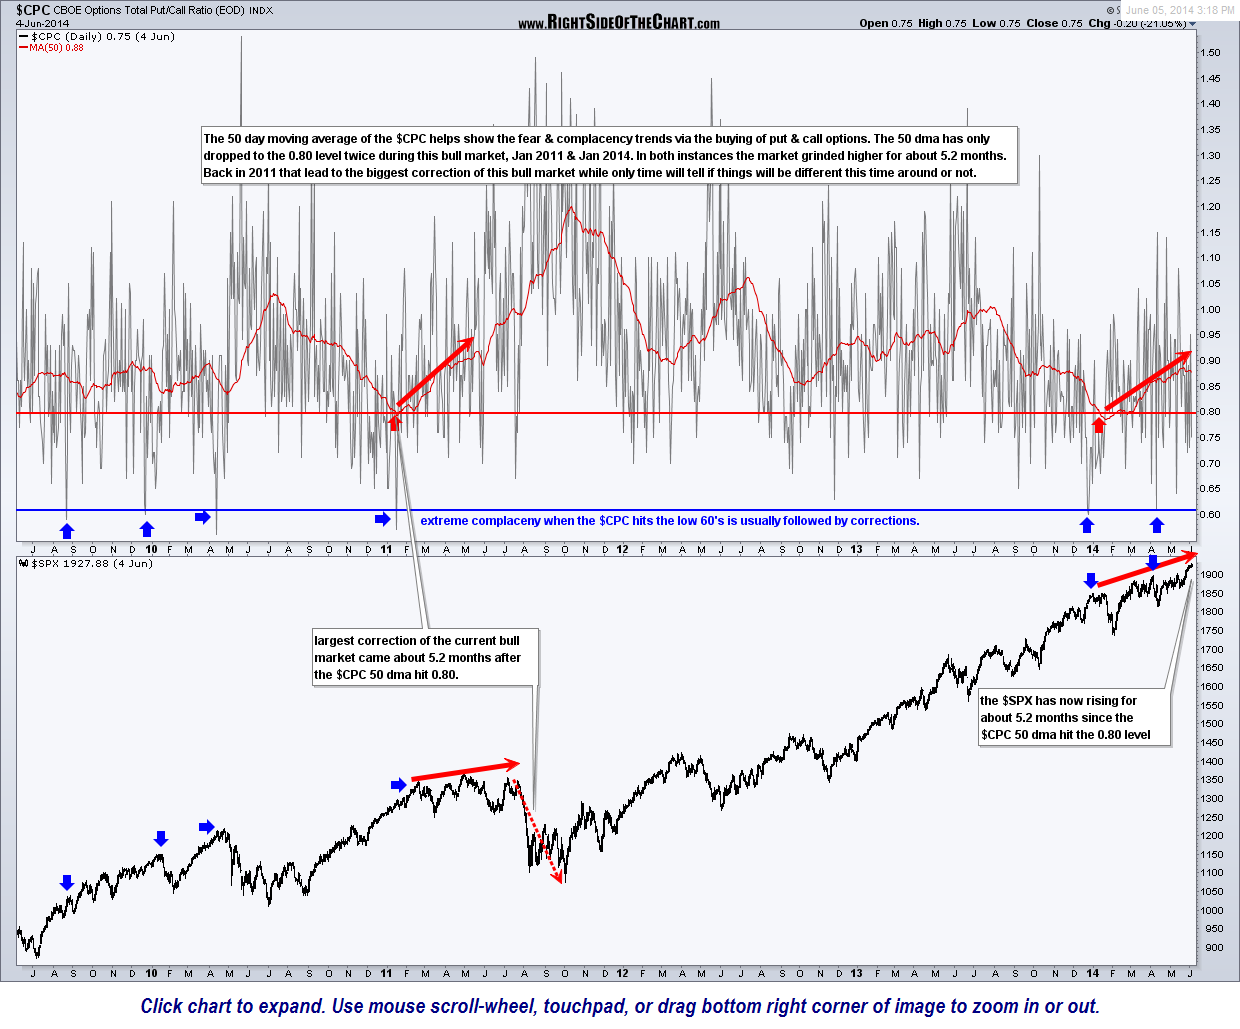
In summary, I continue to believe that the markets do not offer an attractive risk/reward profile on the long or short side at this time and my preference, as it has been for weeks now, remains to keep things light. I’ve have a few questions recently as to what exactly that means. Basically, keeping things light means establishing fewer, if any, new positions and using below average position sizing and overall market exposure. This market may continue to grind higher for months or it could suddenly turn on a dime. Also keep in mind that the 2.6 year primary uptrend line on the $SPX chart above is only about 3% above current levels. That’s just one “bad day” in the market so although the market is trading at new all-time highs today (bullish), the technical picture could change from bullish to bearish in literally just a couple of trading sessions. If long, just make sure to have your stops in place and be aware that with several key sentiment measures such as the $VIX and $CPC currently at or recently coming off extreme complacency readings (see $CPC chart below), when the music finally stops, a reversal could come much faster than most expect.


