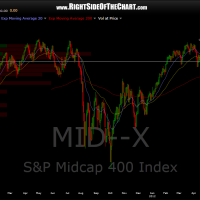
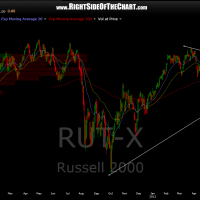
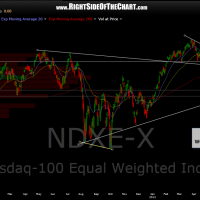
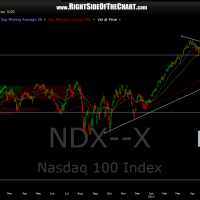
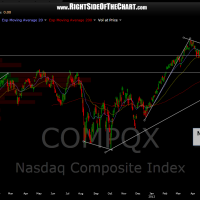
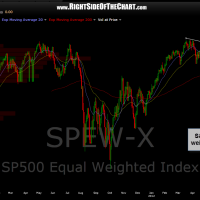
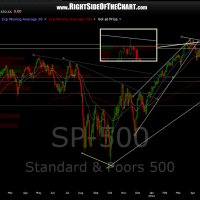
here’s a snapshot of the major US indices showing a mixed technical picture with several breaking above their key downtrend lines from the highs while some others lag behind. as far as where we go from here, i still favor a longer-term bearish bias but there are quite a bit of mixed signals.
on the bullish case, the intermediate term trend since the june 4th lows clearly remains intact and the price action over the last few days has been bullish. there are also lots of bullish patterns in place on the daily time frames and several key stocks and sectors recently breaking above notable resistance levels. we are not too far from breaking out to new highs, which of course is always a bullish technical event.
on the bearish case, most key indexes are at or just below key resistance levels on the monthly and weekly charts. sentiment and volatility measures warn of extreme complacency that usually precedes significant market tops. we also have potentially bearish pattern formations on many of the broad markets such as weekly bearish rising wedge patterns confirmed by negative divergence (see charts below). i’m sure that much more supporting evidence could be added to both cases but for now, we’ll just have to be patient to see how these longer-term charts play out.
it is very common, if not the norm, to see prices penetrate (break above or below) key weekly downtrend lines on an intra-week basis (i.e.- breakout above the daily horizontal resistance or downtrend lines) and then fail by the end of week or even the following week. therefore, be careful chasing too many new long-side breakouts here and also make sure to define your stop parameters on any short trades that you take. overall, i still favor a bearish bias for now but i would not try to short this market aggressively until/unless we see some signs of a likely intermediate & short-term trend reversal.
one thing to keep an eye out for is new long-side pattern breakouts starting to fail. i’ve often noticed at major and intermediate market tops that we have lots of bullish patterns in place but shortly before the top, many of the breakouts start to fail (reverse within a day or so of triggering). i also like to watch the market leaders to for any signs of under-performance, like we are seeing in AAPL, GOOG, & SPG today. one day does not make a trend but something to keep an eye on.


