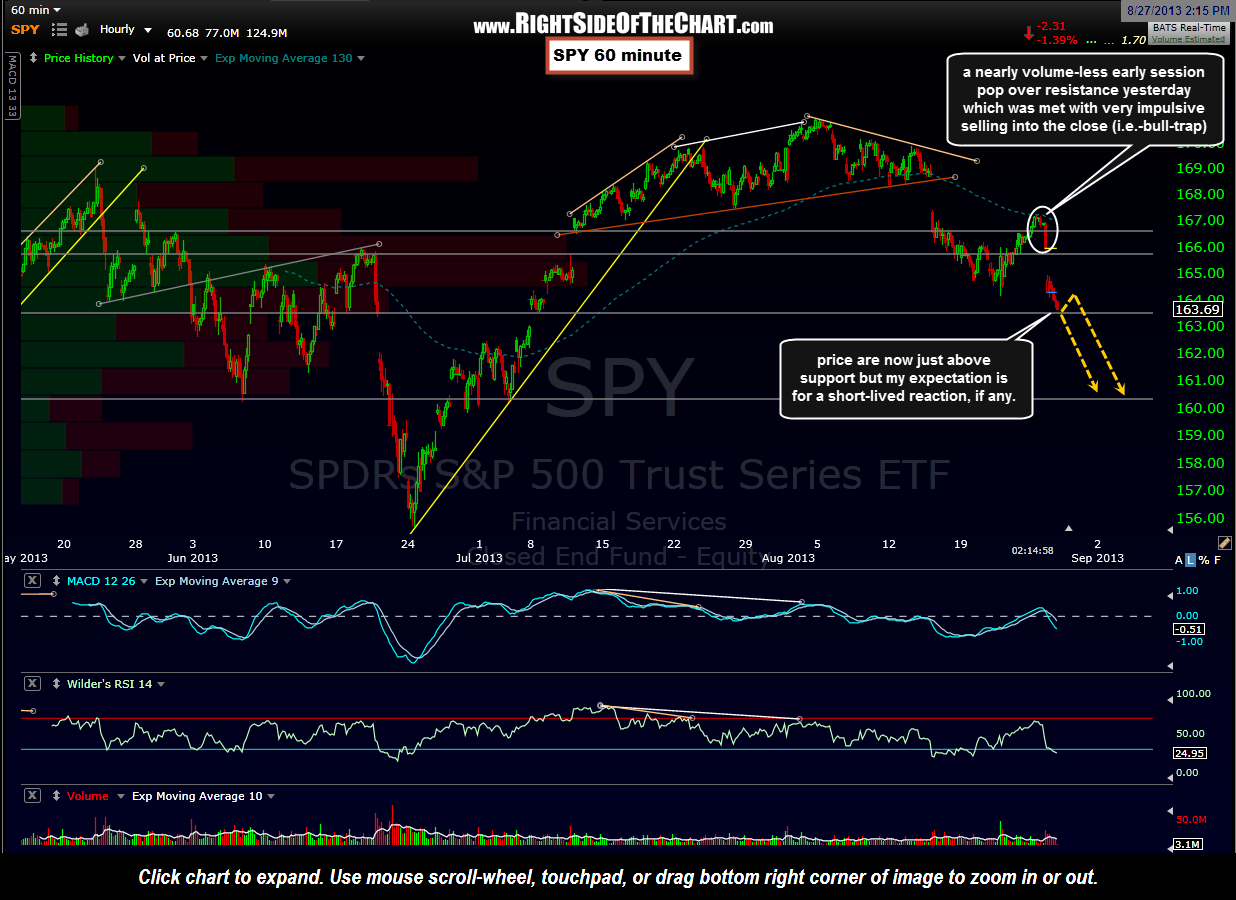
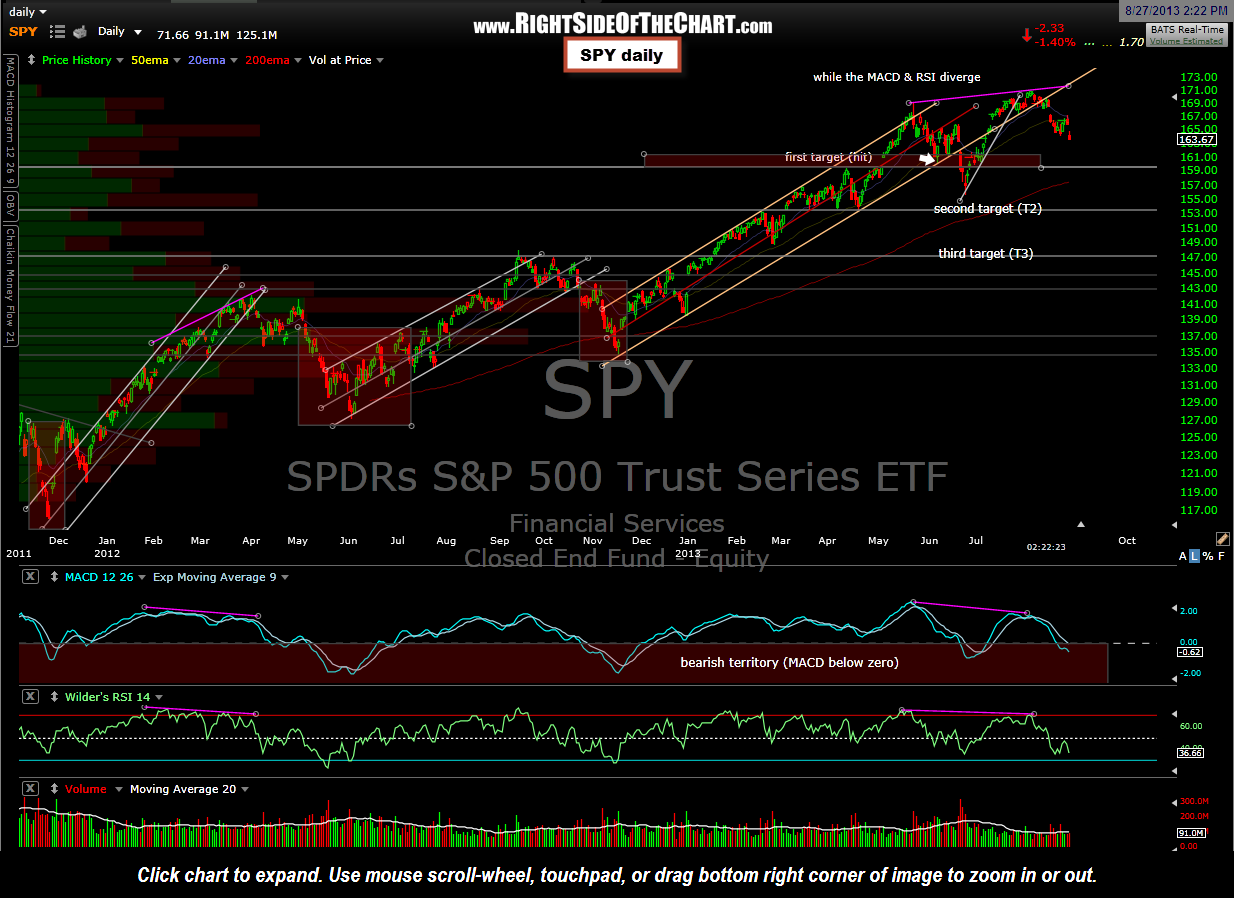
Updated 60 minute & daily SPY chart along with my thoughts. Essentially, I continue to view the outlook for the SPY as simply a continuation of the correction that began with the top that was put in back on May 22nd, with the index just making a very marginal ( about 1%) new high in early August. Really not much different from a short trade that breaks down from an ascending channel or rising wedge pattern, then goes on to make a slightly higher high to shake out the last of the shorts & draw in the last of the buyers before the real selling kicks in. The first target on the SPY was hit back on June 6th with prices reversing just shy of T2 (second target) although the odds look increasingly good that T2 will be hit soon (likely within the next couple of weeks, possibly even days if my read is correct). However, it is worth noting that prices have moved down to support on the 60 minute chart with the MACD & the RSI diverging. Although I don’t expect a very large reaction off this level, it would be prudent to wait until this support level is clearly broken before adding additional short exposure.

Results for {phrase} ({results_count} of {results_count_total})
Displaying {results_count} results of {results_count_total}