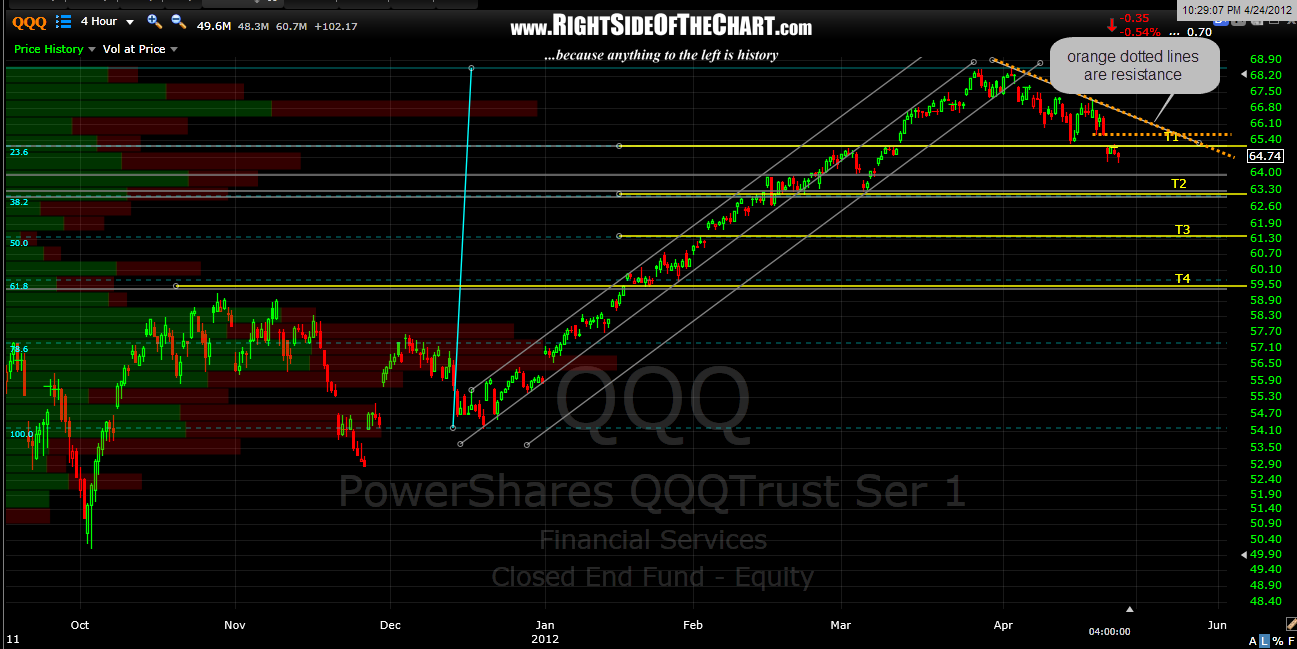
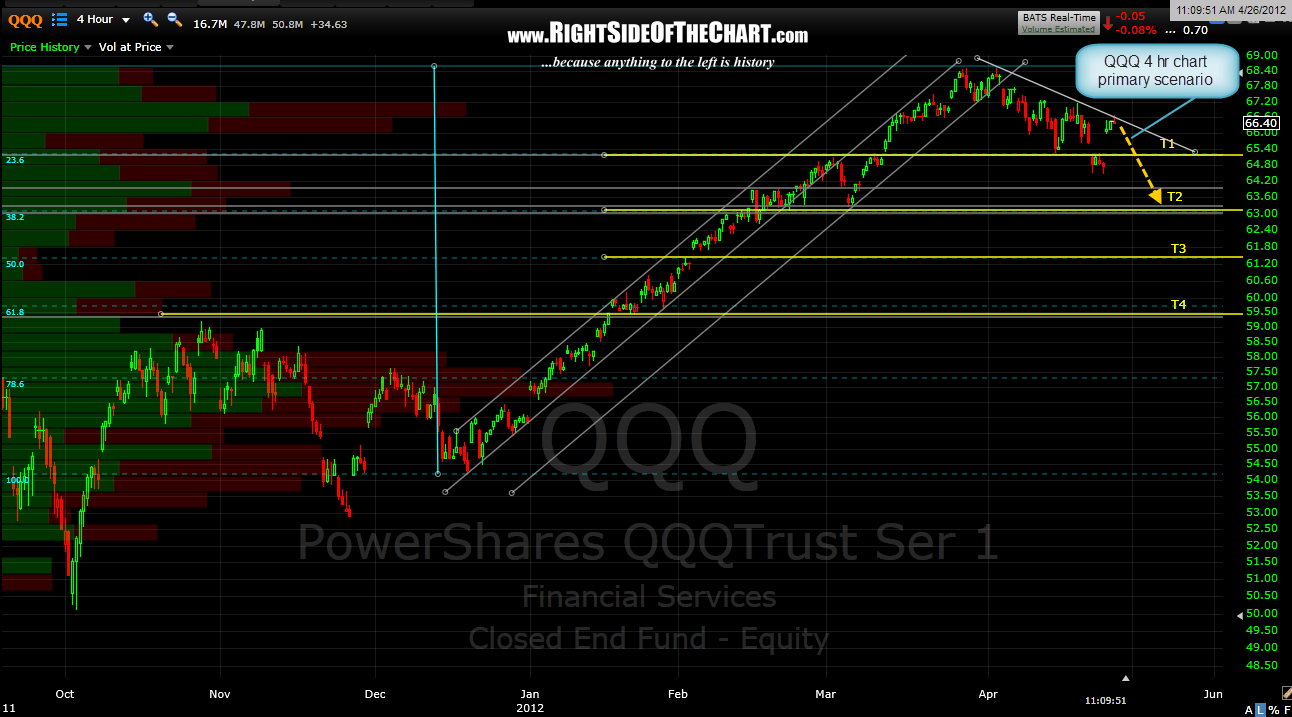
the QQQ has now pushed back to that potential downtrend line added to the last 4 hour chart. i say potential because it takes a least two points to create a trendline but a third reaction off that line to confirm it. so far, the Q’s have tagged that line and pulled back slightly but it is much too early to validate that downtrend line. regardless, prices turning lower from at or near current levels and a resumption of the near-term downtrend remain my primary scenario for now, although my confidence is not high enough to warrant shorting aggressively here. 4 hour QQQ chart below.
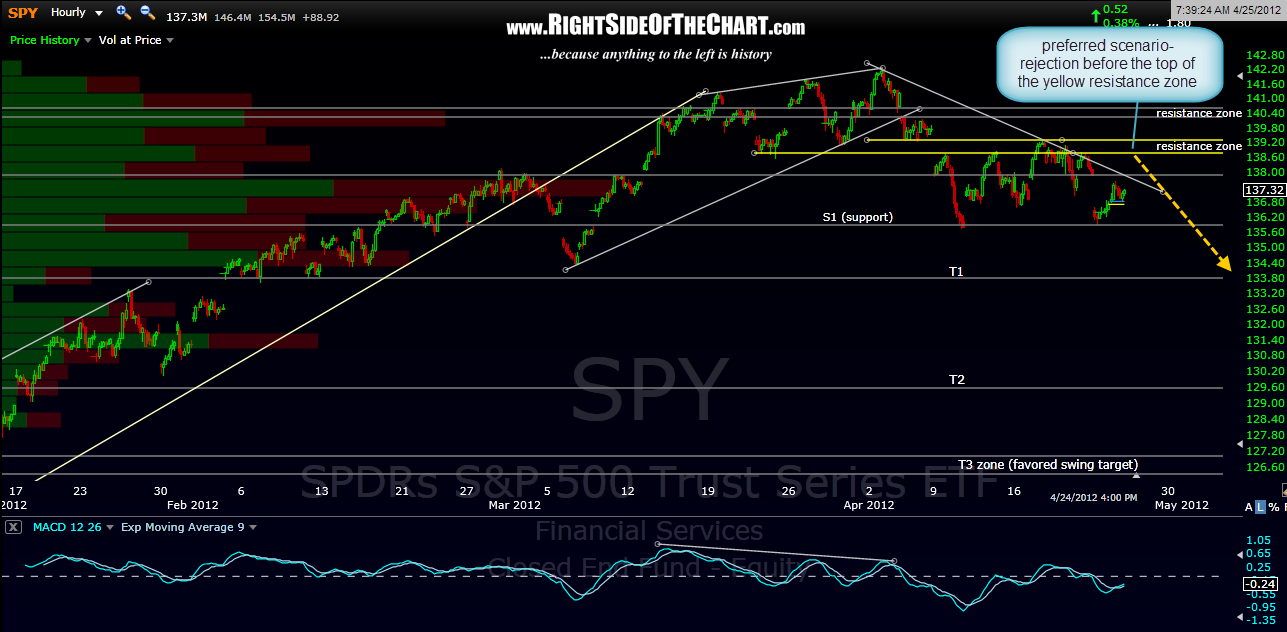
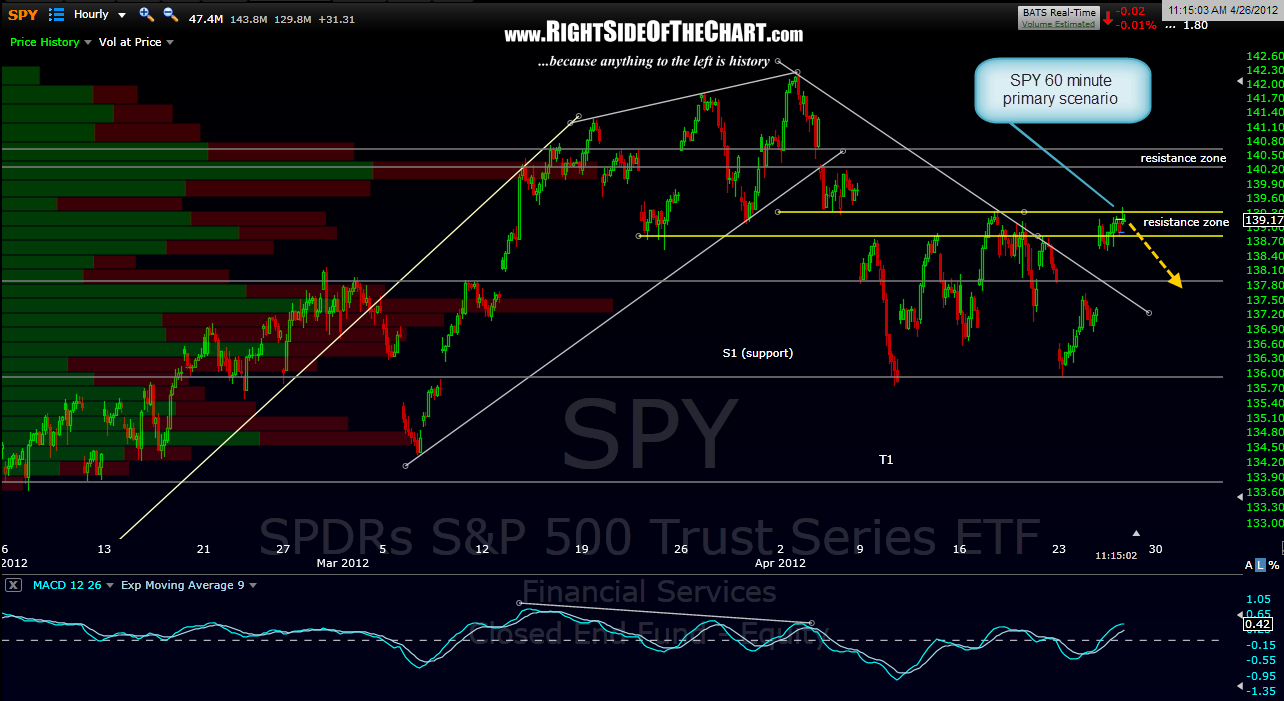
as far as the SPY, this 60 minute chart shows that prices have pushed back to the top of that yellow resistance zone, which is my primary scenario also had/has us turning down before that level is taken out. remember, the GDP report tomorrow could be a market mover so be selective with any new positions that you plan to take home tonight. if these levels are clearly taken out tomorrow, i will adjust accordingly. original charts first, previous second.