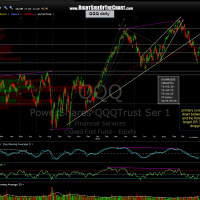
After looking over the charts and taking many things (most of which are not discussed here), into consideration, my primary scenario for the market remains basically the same. In my last market scenario post showing the QQQ daily chart (on Monday the 19th), I listed what I believed to be the three most likely scenarios from that point. You can revisit the notes & chart from that post by clicking here.
Scenario A had the bounce ending basically immediately & the markets turning lower while the two other slight variations which I gave better odds were scenario B; a bounce to around the 200ema area (which I mistakenly typed as 65.50ish vs. 64.50ish on that last QQQ daily chart) or scenario C; a bounce the former T1 or first downside target, which comes in around the 65.30 area. On Friday, the Q’s closed at 64.90, basically at the highs and that put us exactly in the middle of scenarios B & C.
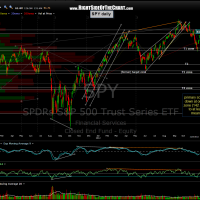
In the updated QQQ daily chart below, I have essentially combined scenarios B & C into one primary scenario which has the QQQ turning down very soon, possibly starting as early as tomorrow or maybe a little more upside to that 65.30 area +/-. As far as the SPY, I believe the current bounce will also likely be capped anywhere from Friday’s highs as well up to the R1 zone that I’ve shown on this chart in the past (142.10 – 143.60 area). The bottom line is that my primary scenario has very little, if any, additional upside in the US equity market before a resumption of the primary downtrend and as such, I will immediately begin moving back towards an net short market exposure by rapidly scaling back into shorts and either booking profits on my few remaining longs or trailing tight stops below.
Also realize that although an alternative scenario is not discussed here, the alternative to this primary scenario would obviously be that the markets continue to climb above the aforementioned resistance areas where I expect them to reverse. If that turns out to be the case, I would suggest setting stops on any broad market short positions taken or added onto this week accordingly (and stops on individual stock shorts according to their own specific technicals.)
There are many current active short trades and recently completed short trades that bounced in-line with the market last week and are at or close to resistance levels where they will once again offer objective short entries or add-ons. I will try to post some of the better looking patterns soon as well as any attractive long setups that I come across for those with a more bullish market bias at this time.


