
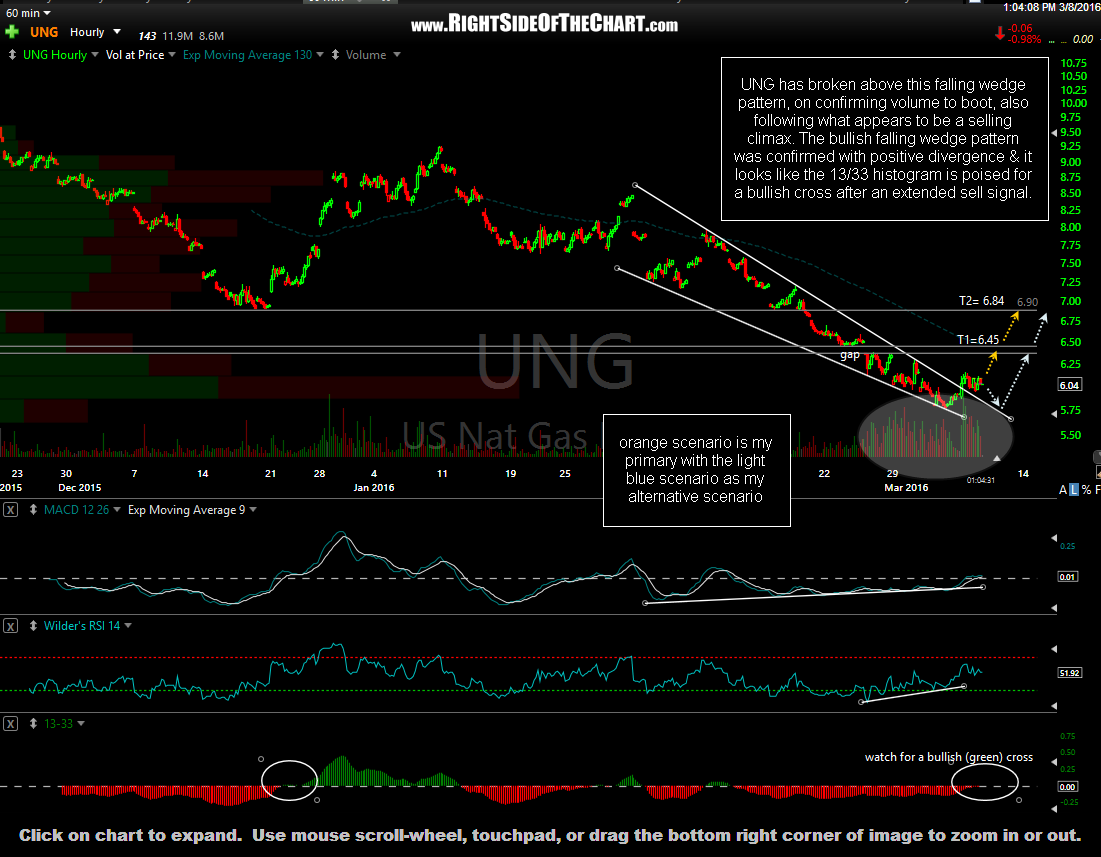
UNG (US Natural Gas Fund ETF) has broken above this falling wedge pattern, on confirming volume to boot, also following what appears to be a selling climax. The bullish falling wedge pattern was confirmed with positive divergence & it looks like the 13/33 histogram is poised for a bullish cross after an extended sell signal.
UNG daily March 8th
There are a couple of ways to play this: The “safer” bet (and keep in mind that the term safe is relative, as UNG is a very volatile & should be considered an aggressive trade) would be to wait for price to break above Monday’s reaction high of 6.17 before establishing a long position. The alternative, more aggressive option would be to establish a partial or full position here, adding when & only if UNG takes out the 6.17 level.
Personally & officially (as far as a trade idea) I’m going to go ahead and add UNG as an Active Long Trade here at 6.01 (official entry), or any level up to 6.22 and down to 5.75. My preference is to establish a partial position here in order to allow for a possible backtest of the wedge at lower levels, quite possible on a marginal now low. I will add to the position either on a backtest of the wedge but now lower than 5.75 with stop not too far below that level (to be determined on my average cost basis using at least a 3:1 R/R to the price target). T1 is just below the top of that gap at 6.45 with T2, my preferred target, at 6.84 (just below the 6.90 resistance level).