
While most certainly an aggressive, counter-trend trade, TVIX (2x short $VIX volatility index ETN) will be added as an official long trade here as the R/R for a long entry just above the 177.28 support level with bullish divergences building seems favorable. In fact, TVIX will continue to offer an objective long entry down to as well as slightly below the 177.28 support level to the bottom of the price channel (i.e.- the lower downtrend line). As such, one could also take a starter position on TVIX here, scaling in down to but not below the bottom of the price channel.

TVIX 60m May 6th
The price targets for this trade are T1 at 247.94, T2 at 296.80, and T3 at 395.55. The maximum suggested stop is a daily close below 134.97 although a higher stop should be considered if only targeting T1 and/or T2. To account for the 200% leverage & volatile nature of the $VIX, the suggested beta-adjusted position size is 0.35-0.50 (depending on one’s risk tolerance).
The last official trade on TVIX was closed out on February 25th when the final target was hit for a 65% profit. As with that previous trade, in which TVIX was entered back on Jan 29th when the stock market was humming along to all-time highs with the vast majority of market participants bullish, I suspect there is little interest in going long volatility which in essence, is analogous to a going short the stock market. As I had said back then, one should pass on this type of aggressive, counter-trend trade if it does not mesh with your trading style, risk tolerance, and/or outlook for the stock market.
To recap the recent price action in the $VIX, about a 6-7 weeks ago, as the $VIX was approaching its all-time high which was put in back October 2008, I was highlighting the fact that the $VIX peaked at that Oct high, over 4 months & more than 20% before that bear market ended. I was also clearly stating that the R/R was no longer skewed to being long the $VIX, rather short, based on both the technical posture of the $VIX, extreme bearish sentiment & P/C ratios, as well as the bullish divergences & extreme overbought conditions in the stock market. $VIX weekly chart below.
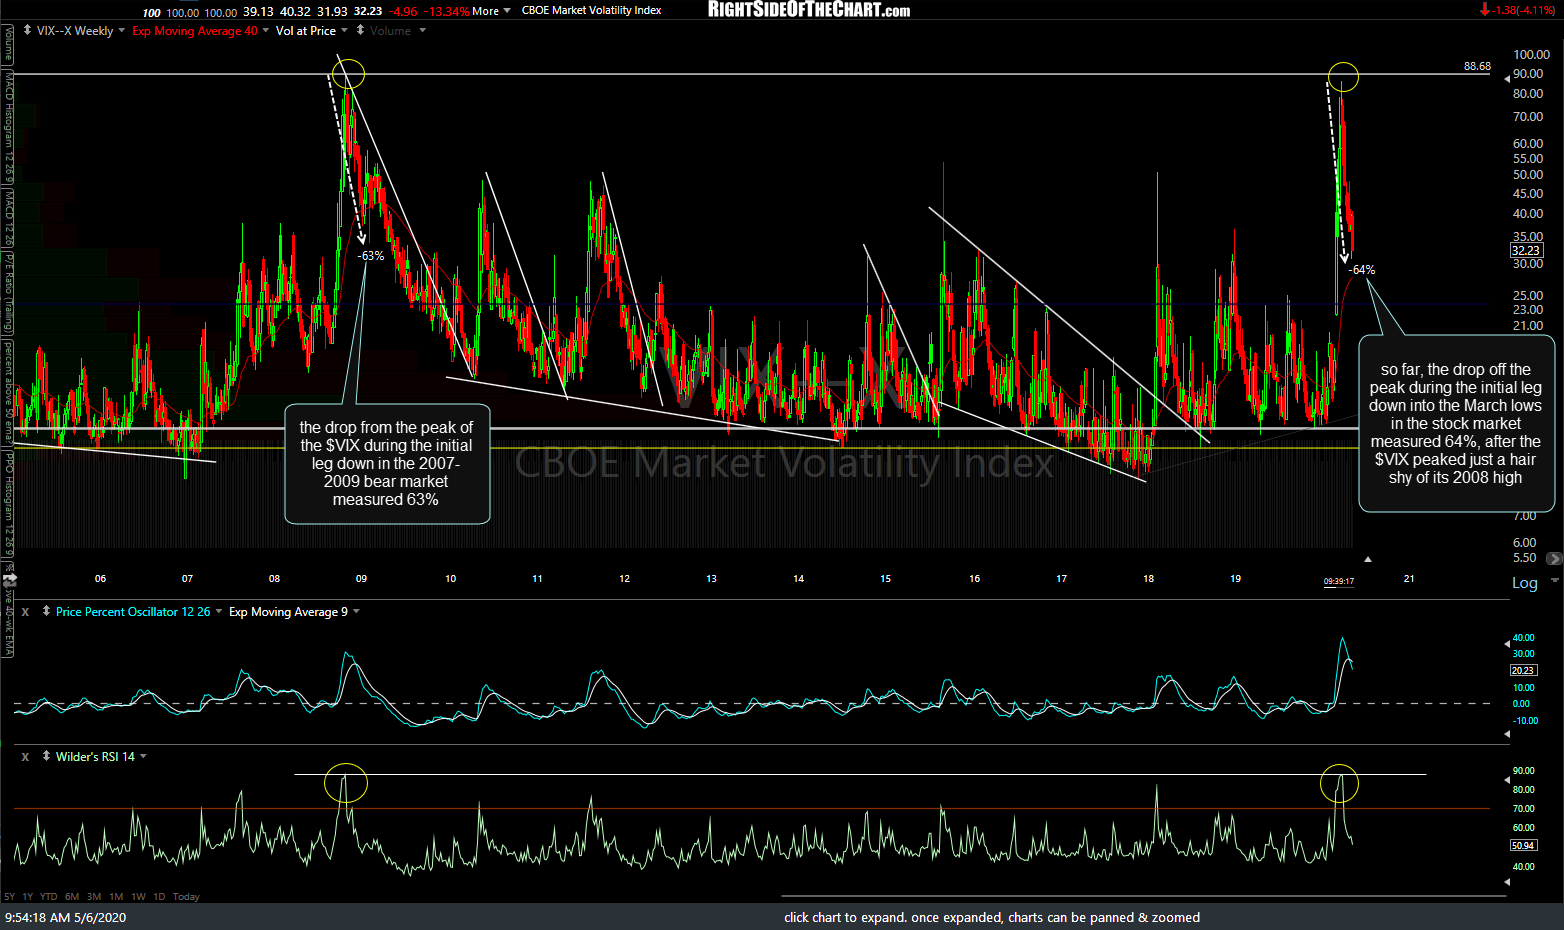
VIX weekly May 6th
Since peaking just a hair shy of that 2008 all-time high, the $VIX has dropped 64% into last week’s lows. Coincidentally or not, after that previous peak during the 2007-’09 bear market, the $VIX dropped 63% from there before the first counter-trend rally (+72%) in a near bear market for the $VIX which began long before the bear market in the stock market ended (a fact that I was highlighting in numerous videos around the time the $VIX peaked in March). History doesn’t always repeat although it does often rhyme. 60-minute chart of $VIX below.
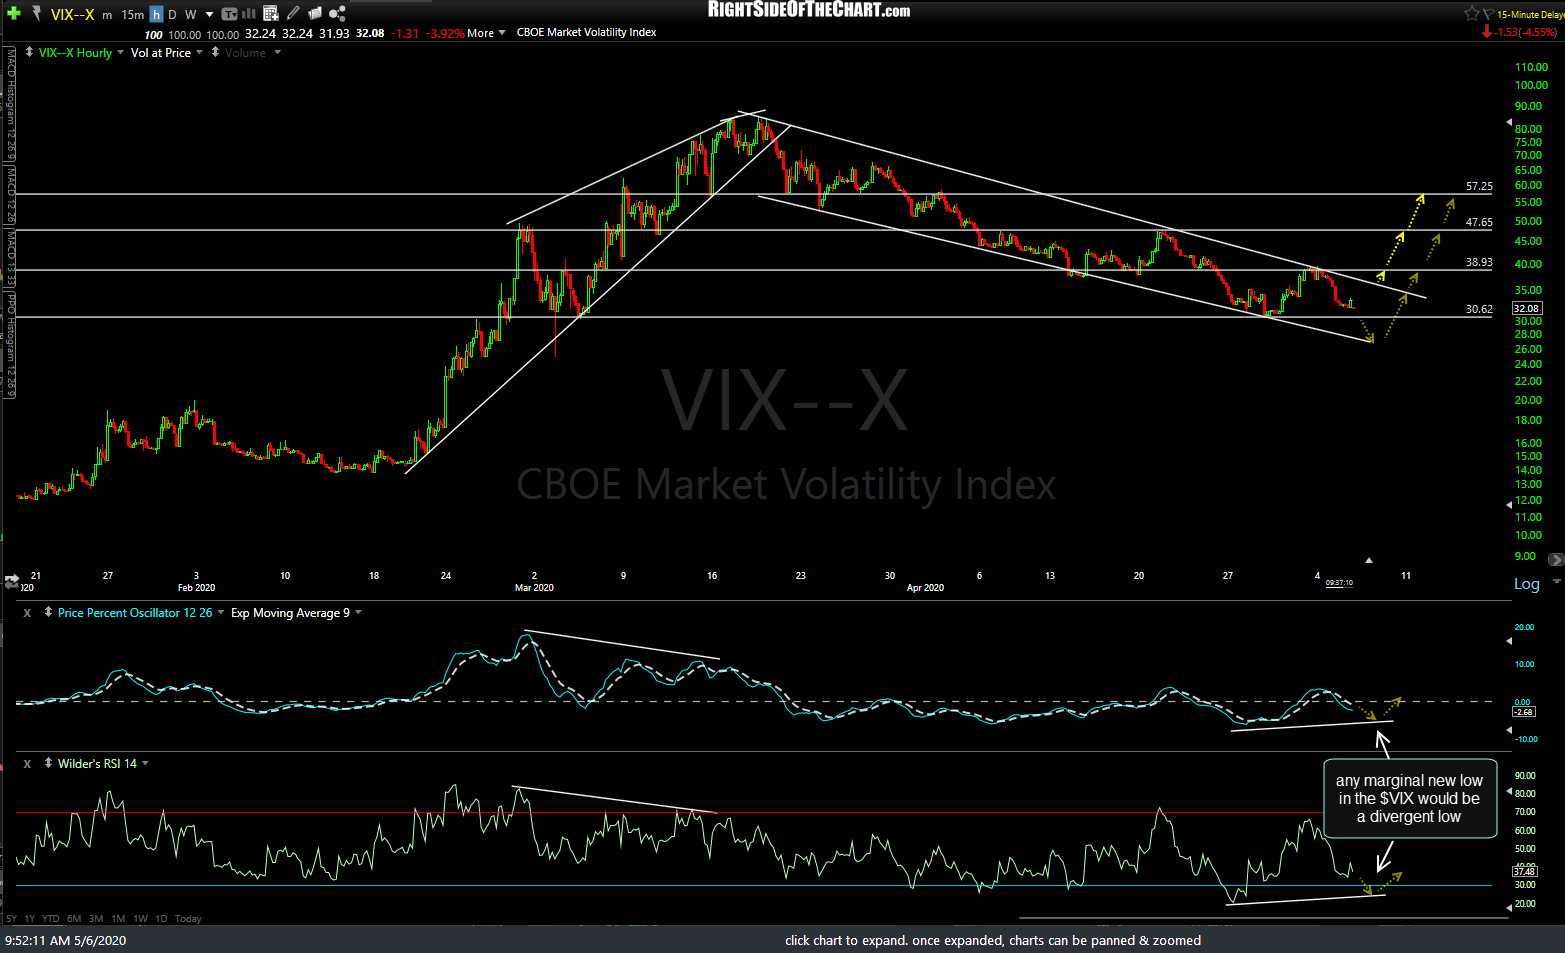
VIX 60m May 6th
The takeaways from all that are:
- The extreme put buying during the initial leg of a bear market following persistent & extreme low put/call ratios leading up to the peak of a bull market often leads to the biggest surge in the $VIX within the bear market, although the peak in the $VIX does not coincide with the end of the bear market in the stock market.
- Even if the $VIX put in THE top back in March and has begun a new bear market (which is not set in stone), there will always be counter-trend rallies along the way & due to the volatile nature of the $VIX, many of those rallied will measure well into the double-digits. As such, $VIX tracking instruments such as TVIX can be used for relatively quick ‘tactical’ swing trades in an attempt to profit from the counter-trend rallies as well as longer-term swing trades to capture to the larger waves within the trend, although my preference is to only make tactical trades on the $VIX, especially if trading the $VIX tracking ETNs.
- Keep in mind that going long TVIX is essentially an indirect short on the stock market so any position should be factored into one’s overall portfolio positioning regarding diversification, net long/short exposure, etc..
- I still have my concerns regarding the use of leveraged ETFs & ETNs, particularly those that track very volatile underlying sectors, indexes, or commodities. However, with the recent abatement in volatility, those risks have mitigated for the time being. With that being said, be aware that TVIX is inherently riskier than a non-leveraged, widely-held ETF such as SPY or GLD, hence, the 0.35%-0.50% suggested position size adjustment and that assumes that any position only represents a relatively small sliver of one’s total portfolio.