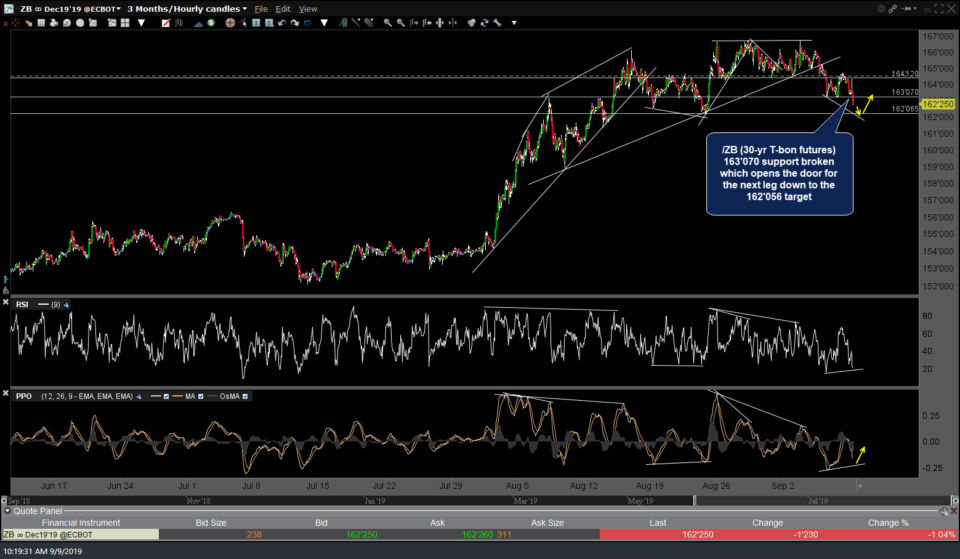
The /ZB (30-yr T-bond futures) 163’070 support level has now been broken which opens the door for the next leg down to the 162’056 target/support.
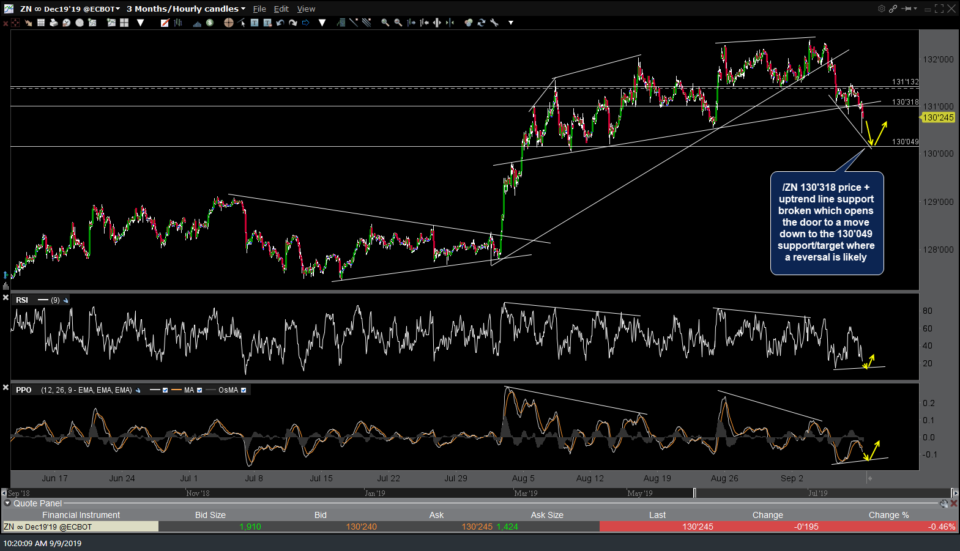
Likewise, the /ZN (10-year T-bond futures) 130’318 price support + uptrend line support has also been taken out which opens the door to a move down to the 130’049 support/target where a reversal is likely.
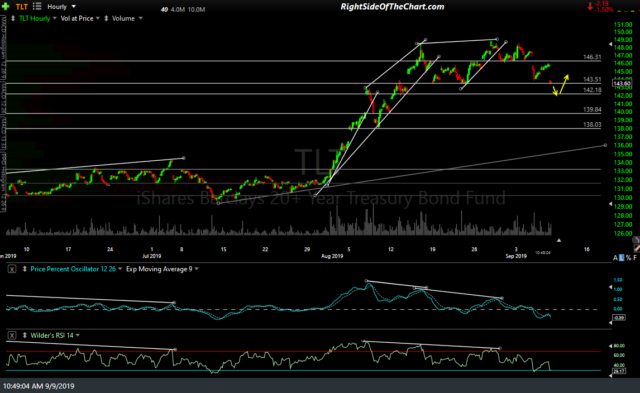
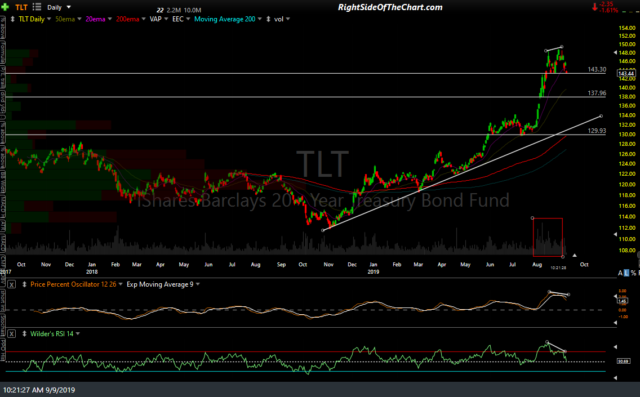
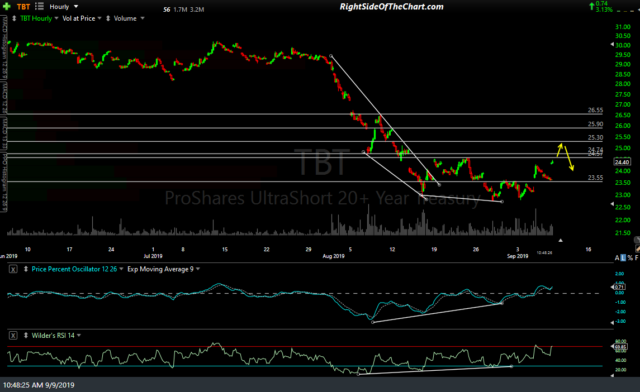
As the T-bond futures above trade nearly around the clock, those charts provide much better visibility to identify salient technical levels & developments such as support levels, divergences, trendlines, etc. However, for those that prefer to trade ETFs over futures, here are my 60-minute charts of TLT & TBT along with the TLT daily chart with some key levels on each.
- TLT 60-min Sept 9th
- TLT daily Sept 9th
- TBT 60-min Sept 9th


