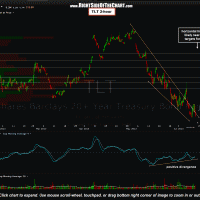
As mentioned recently, TLT (and other related US Treasury ETF’s & futures contracts) are likely to reverse trend and bounce in the near-term should the equity markets experience significant downside from where we closed today. Here’s the updated TLT daily chart, showing prices still clinging to that lower downtrend line along with a 2-hour period TLT chart showing a falling wedge/contracting channel-type pattern, albeit somewhat sloppy with a recent false breakout. However, note the strong divergence in place on the MACD below. The final chart below is a 30-minute period of 10 year US Treasury Futures which shows prices recently breaking above and successfully backtesting a descending channel (again, with strong divergence in place on the recent lows).
The 2 hour chart above has several horizontal resistance levels added which would be my likely targets although I my confidence on how far a bounce might go, assuming that we do get one soon, is not high enough to state my preferred target. Again, a trend reversal in TLT/treasuries soon is largely predicated largely on additional downside in broad markets. Although I’m not adding TLT as an official trade at this point, if one were interested in playing a bounce, consider a beta adjustment of at least 1.5 – 2.0% (1.5 – 2.0 times your normal position size) to account for the relatively low volatility and expected percentage gain/loss relative to equity trades. UBT (2x long 20+ yr Treasury ETF) is another option allowing one to use a smaller position size or futures contracts for more experienced traders.


