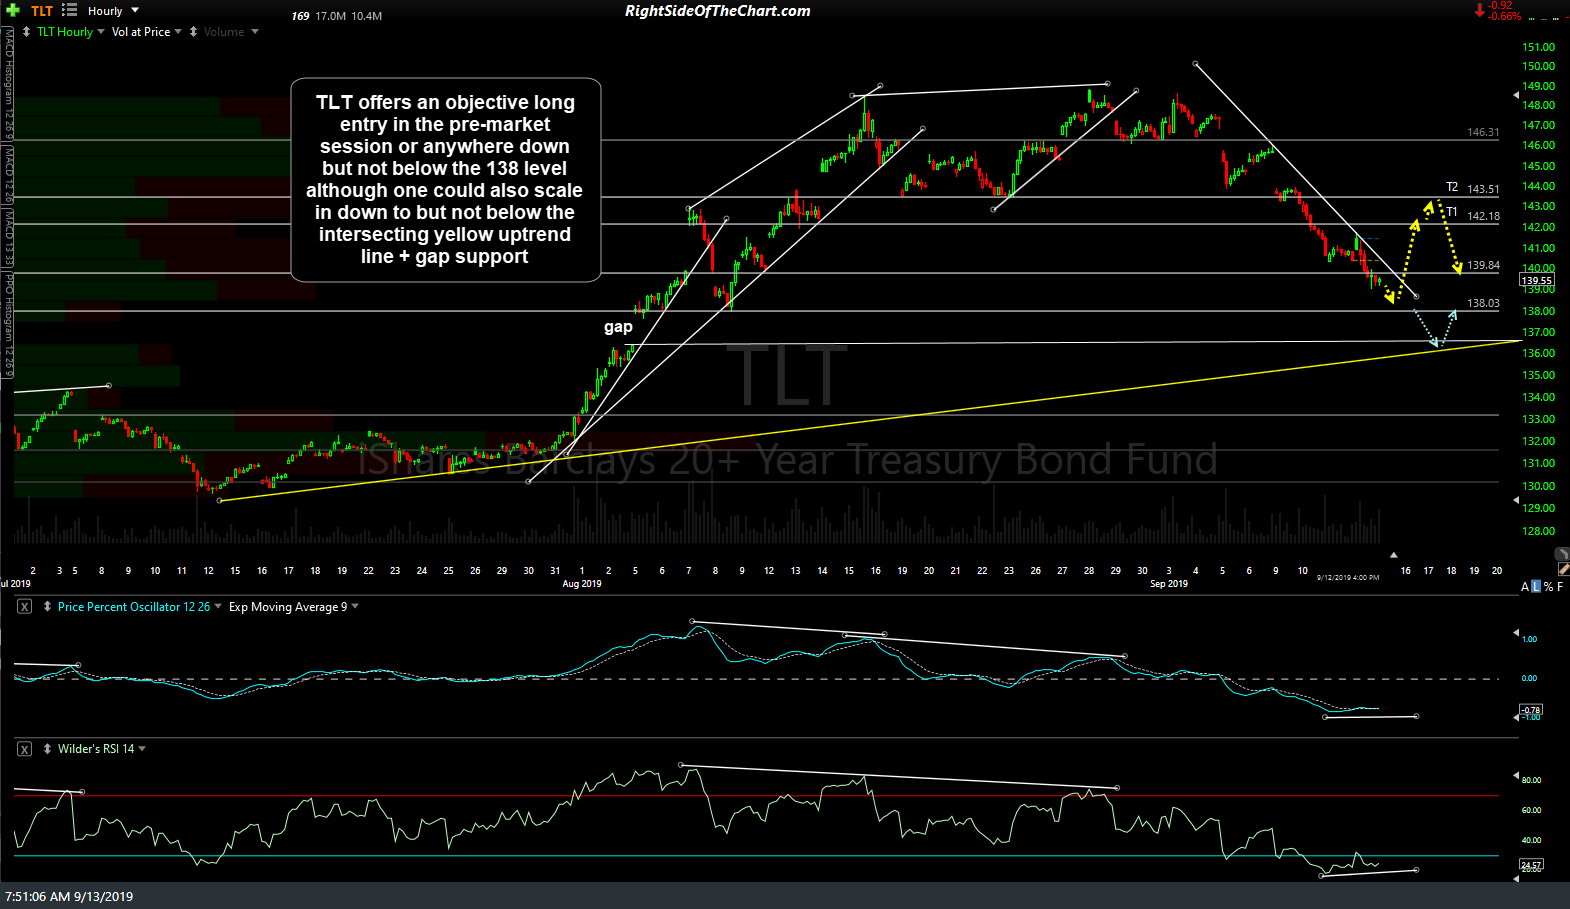
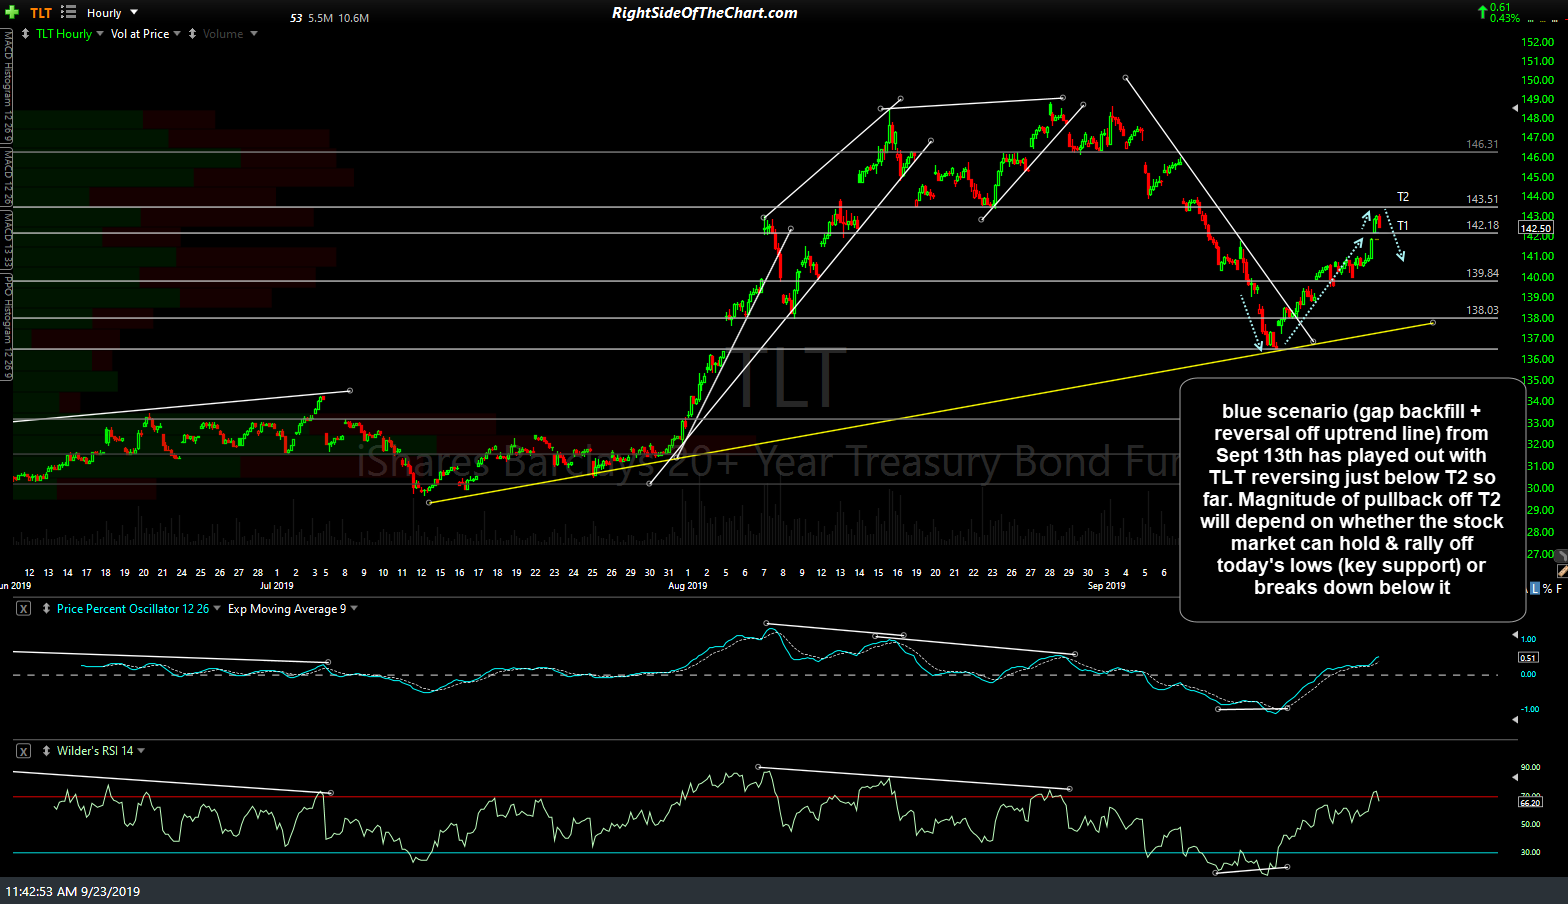
The blue scenario (gap backfill + reversal off uptrend line) from Sept 13th from the first chart below has played out with TLT (20-30 yr Treasury Bond ETF) reversing just below T2 so far. The magnitude of pullback off T2 will depend on whether the stock market can hold & rally off today’s lows (key support) or breaks down below it.
-

- TLT 60-min Sept 13th
-

- TLT 60m Sept 23rd
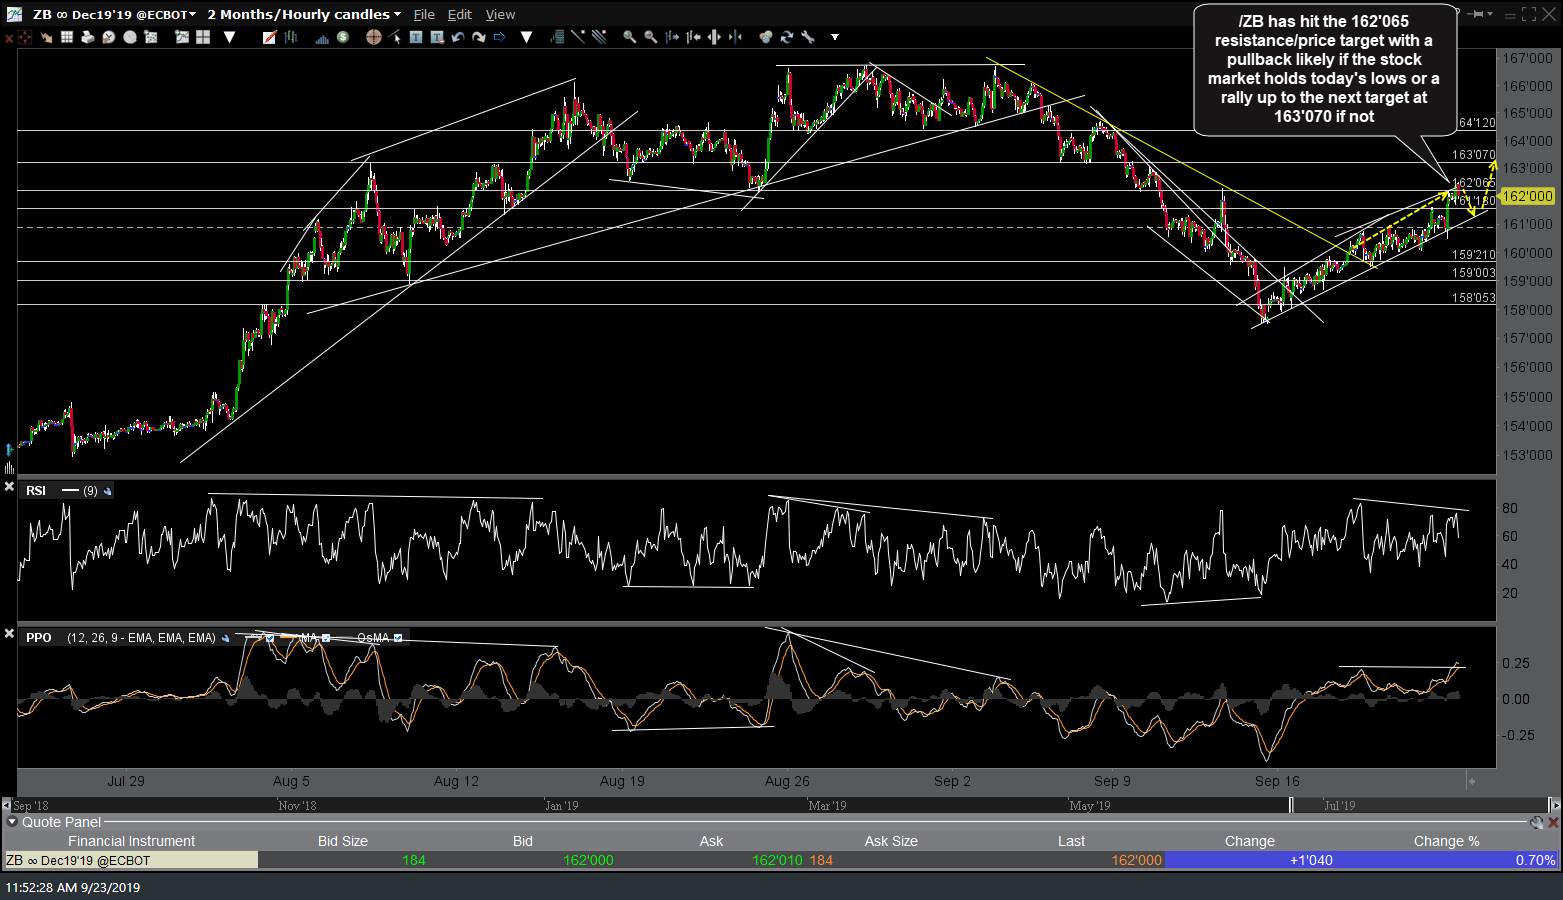
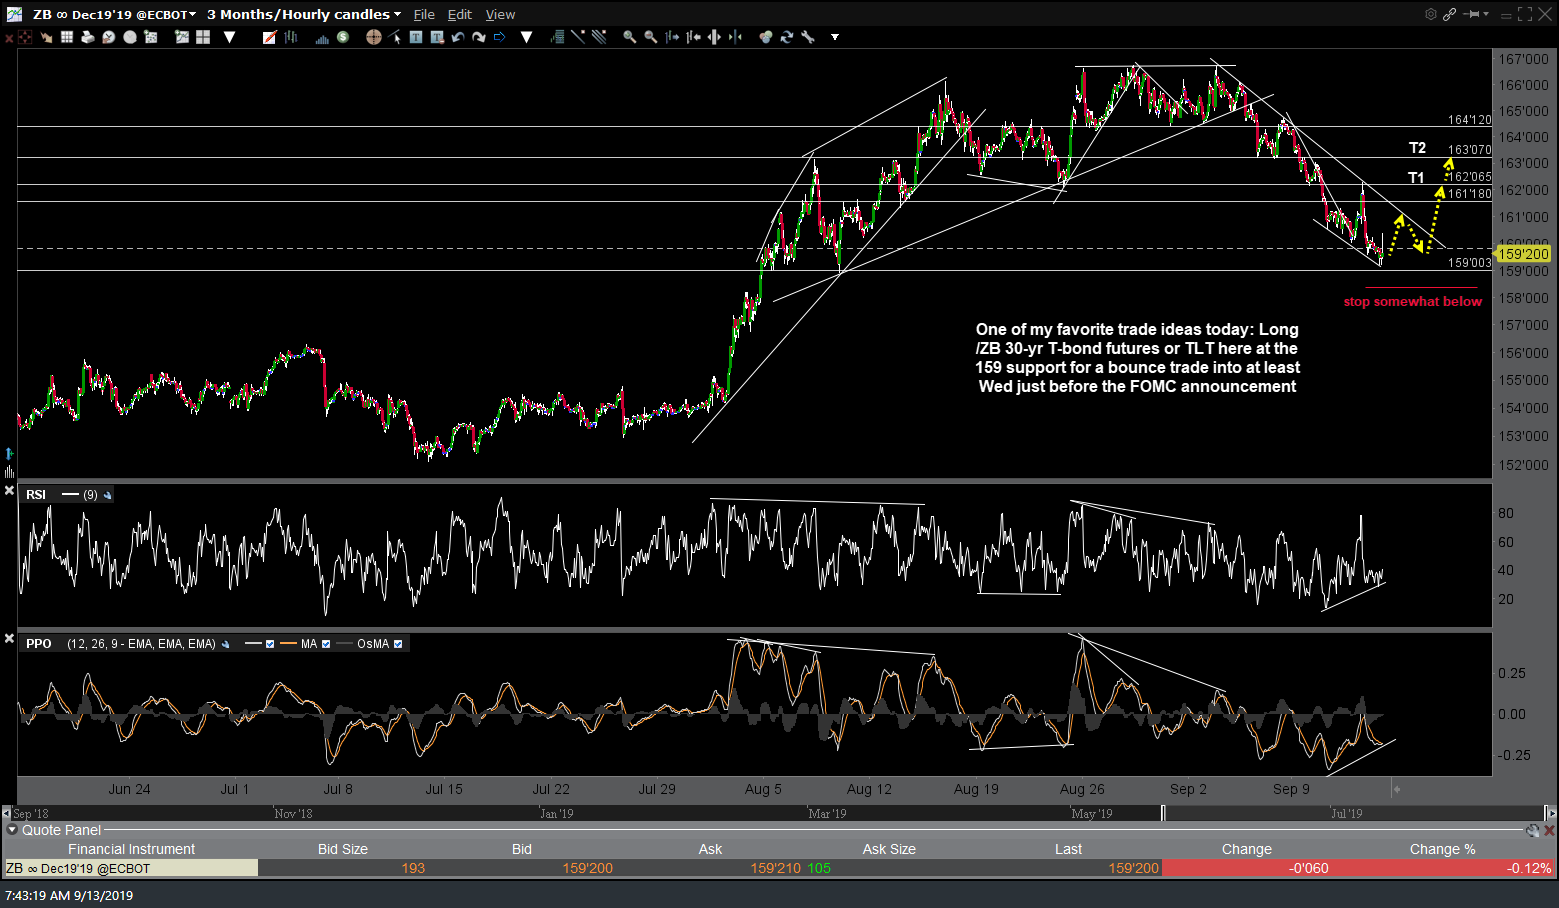
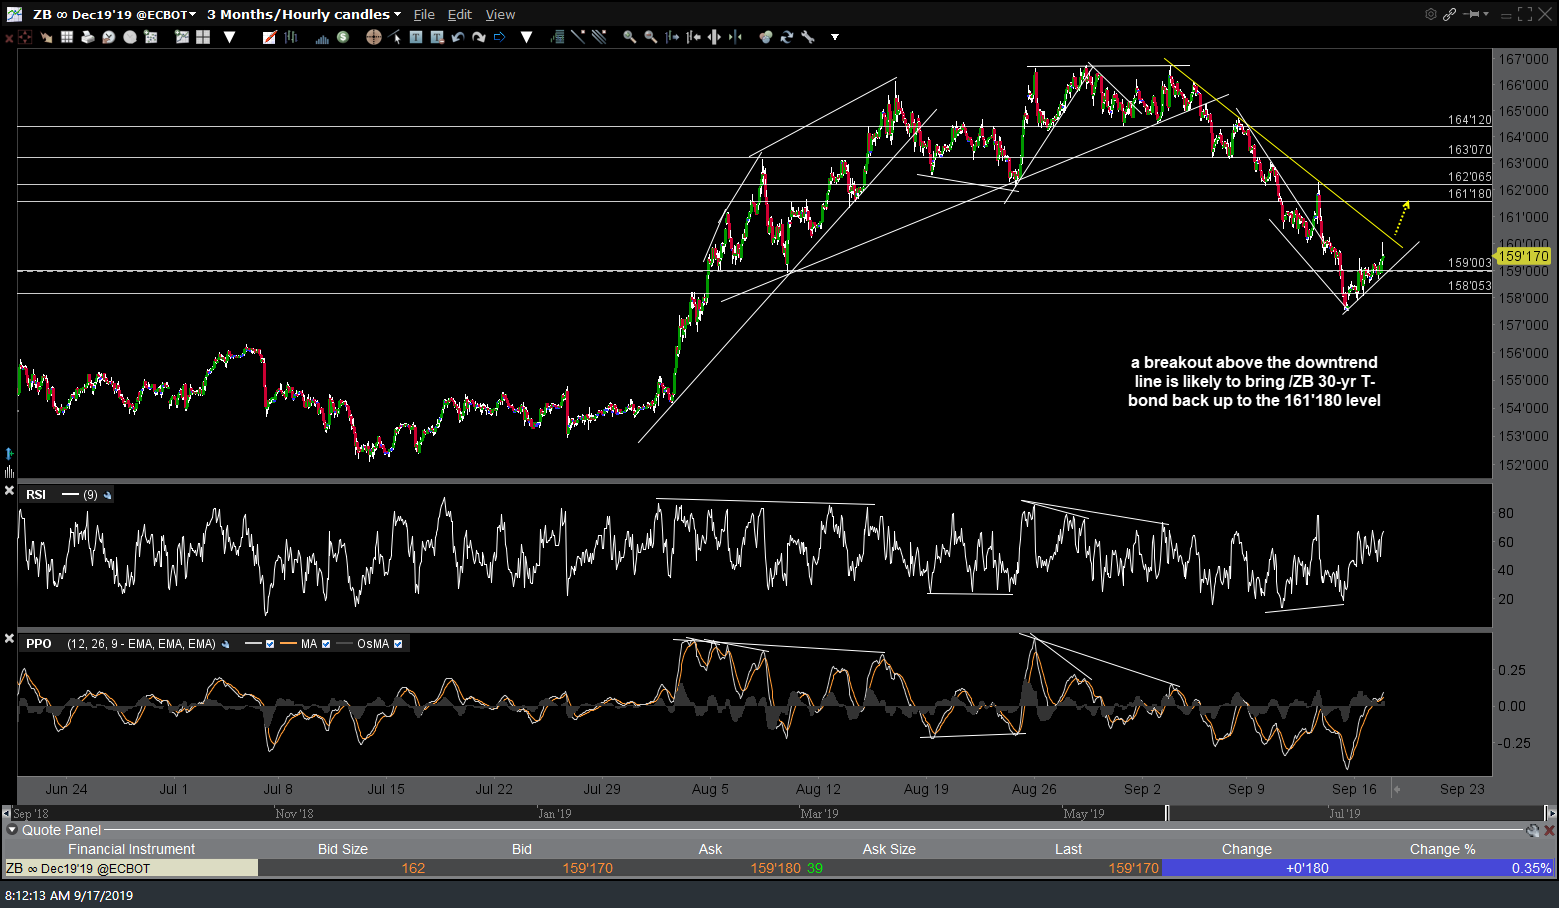
Likewise, /ZB has also hit the 162’065 resistance/price target with a pullback likely if the stock market holds today’s lows or a rally up to the next target at 163’070 if not. Since that breakout above the yellow downtrend line that was also highlighted back on Sept 13th (first chart below), /ZB played out as predicted with both an immediate backtest of the minor uptrend line & several subsequent backtests, offering several additional objective long entries although at this time, the R/R for new long positions is no longer favorable with the stock market testing & so far holding above key support today.
-

- ZB 60-min Sept 13th
-
- ZB 60m Sept 17th
-
- ZB 60m 2 Sept 23rd