
TLT has traded slightly below my suggested stop level but in hindsight (my apologies), that stop was probably to rigid based on the charts. As a full-time trader with the luxury of being in front of the computer during trading hours, most of my stops are mental vs. hard stops (i.e.- standing GTC stop-loss orders). For those that took the TLT long and were stopped out today, that could prove to be a good thing if the etf continues lower. My stated preference yesterday was to use a stop placed about 10 cents below yesterday’s low of 109.28 (which is would equate to a loss of less than 0.4% on the trade if stopped out). That was an unusually tight stop and again, in hindsight, too rigid based on the charts. Here’s a 5 minute chart showing some pretty strong positive divergence forming as prices make this marginal new low today as well as an updated 60 minute chart, showing that prices remain at the bottom of the descending channel.
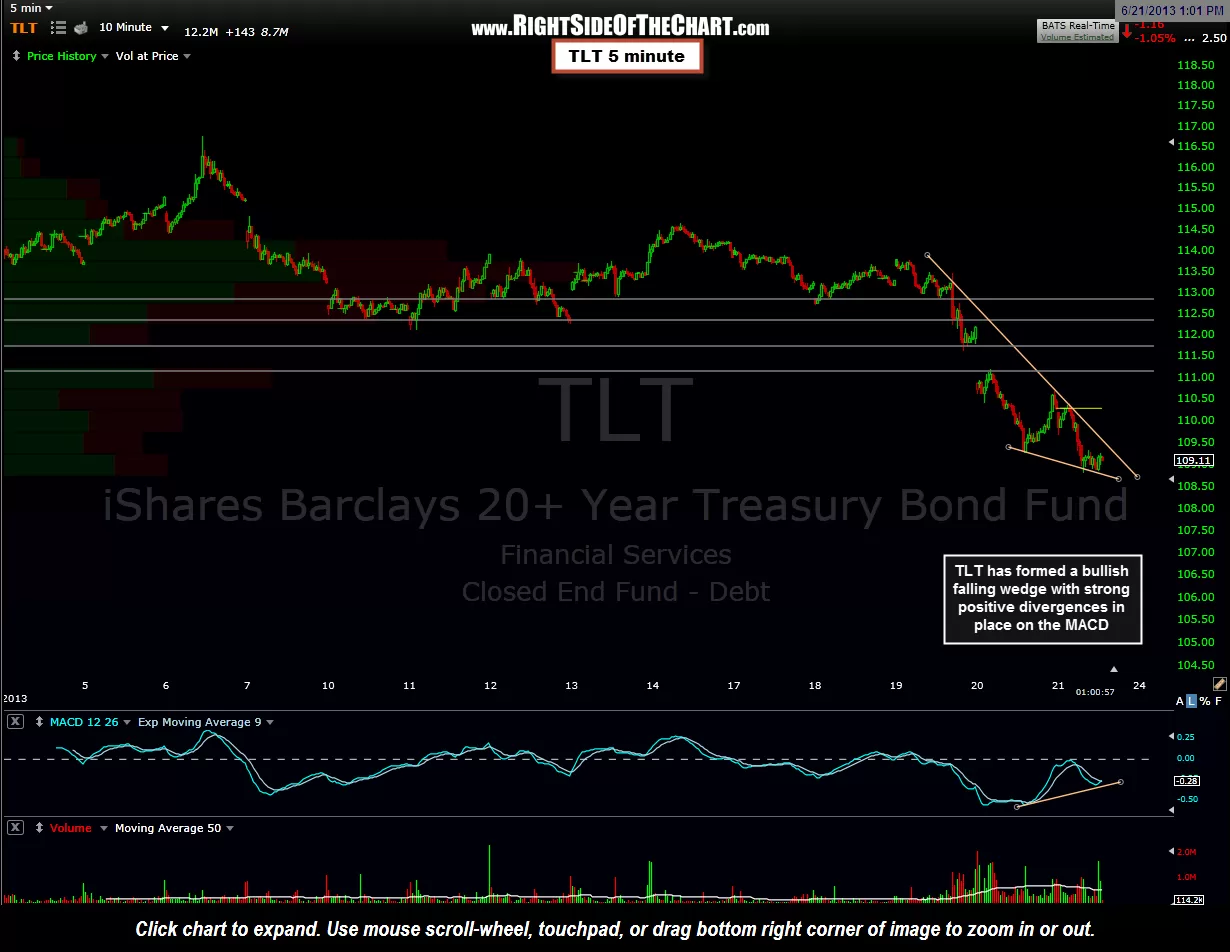
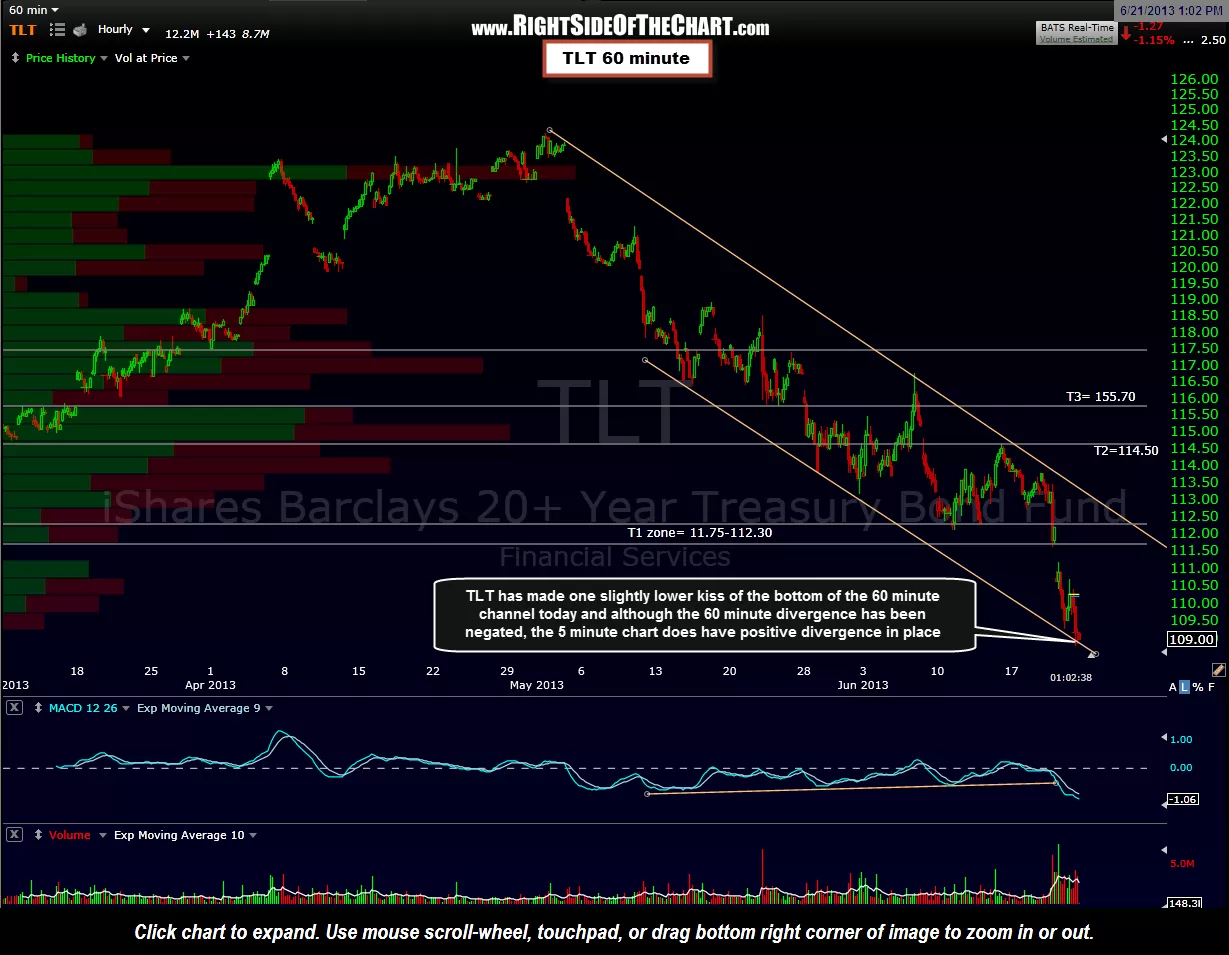
With that being said, I will not allow much more downside on this trade and for those already stopped out, a break above that 5 minute falling wedge might provide an objective re-entry not far from yesterday’s suggested stop level. Trading is all about being flexible and while some traders prefer very entry and exit criteria, my trading style is more flexible and adaptive to changing market conditions. I could remove TLT as the suggested stop was exceeded but I’d just end up adding it right back on as a new setup and so I will leave it as an active trade for now. Had I not been focusing on the existing & new equity trade ideas, I would have made a point to share my thought on TLT earlier. Updated 5 minute & 60 minute charts.