
As we already have the closely related IEF (7-10 year Treasury Bond ETF) listed as an Active Swing Trade idea, I’m passing this one along as an unofficial trade idea. Official trade ideas always list specific price targets, suggested stops & beta-adjusted positions sizes. Additionally, all official trade ideas are always followed up with updates such as when price targets are reached along the way as well as when the final price target or the maximum suggested stop are hit.
TLT daily Feb 22nd
Due to the amount of time & effort involved with annotating the charts, composing & publishing the updates, etc.. on the official trade ideas, there are easily 10 or more unofficial trade ideas shared on RSOTC for every one official trade idea. While official trade ideas are always posted on the front page of the site, accessible to both Silver & Gold level subscribers, unofficial trade ideas are typically shared within the trading room (Gold level access only) as well as member restricted videos posted on the front page, often covering the most promising trade ideas within a particular sector that appears poised for a substantial rally or correction.
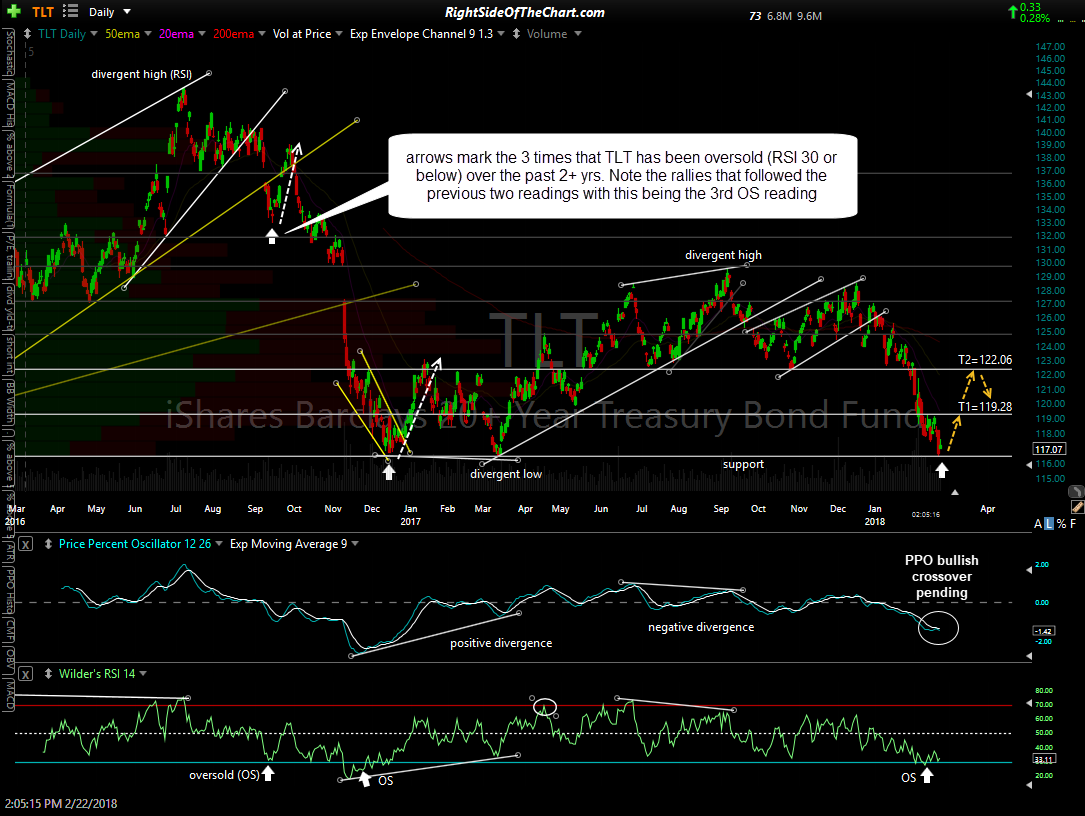
TLT (20+ Year Treasury Bond ETF) appears to offer an objective long entry around current levels for a counter-trend rally up to the 122.50ish area. I’ve listed a couple of “adjusted” price targets, meaning that just as with the official trade ideas, these price targets are strategically set slightly below the actual resistance level in order to minimize the chance of missing a fill on your sell limit order, should the sellers step in early with TLT reversing just shy of resistance.
Should my preferred & final target (T2 at 122.06) be hit, that would account for a gain of about 4.3% from current levels so using a R/R of 3:1 (allowing $1 of loss for every $3 of profit) an objective stop could be placed below 115.40-115.30. A move down to that level will have also taken TLT below the 116.50ish support level which is defined by the late 2016 & early 2017 reaction lows. TLT already bounced off the 116.50ish support level today after falling to that level for the first time in almost a year yesterday but any additional test of & slightly below that level will still offer objective long entries or add-ons to an existing position taken here.
As treasury bonds are much less volatile than equities, rarely gaining or losing more than 2% in a single trading session, those interested in this trade might consider a beta-adjusted position size of 1.5 – 1.8 (i.e.- 1½- 1.8x a typical position size on a trade such as SPY). Additional analysis on TLT as well as IEF, $TYX, $TNX & $FVX (30, 10 & 5-year treasury yields) can be viewed starting at the 14:50 minute mark in the Trade Ideas video posted earlier today or by clicking here. I also posted the following chart & comments in reply to an inquiry on $TYX in the trading room earlier today.

TLT 4-year 2-day period 2-28-18
Here’s a 4-year, 2-day period (each candlestick represents 2-days of trading vs. one) of TLT. If this is the trendline that you are referring to, I have it drawn so that TLT is testing it now after a slight overshoot yesterday. Also note the oversold readings that I circled on the RSI below, with the previous two readings coming at or shortly before significant bottoms in TLT.
I also covered the chart & some key developments to watch for on $TYX (30-year treasury bond yield) in the video that I just posted along with the 5 & 10 year bond yields as well.