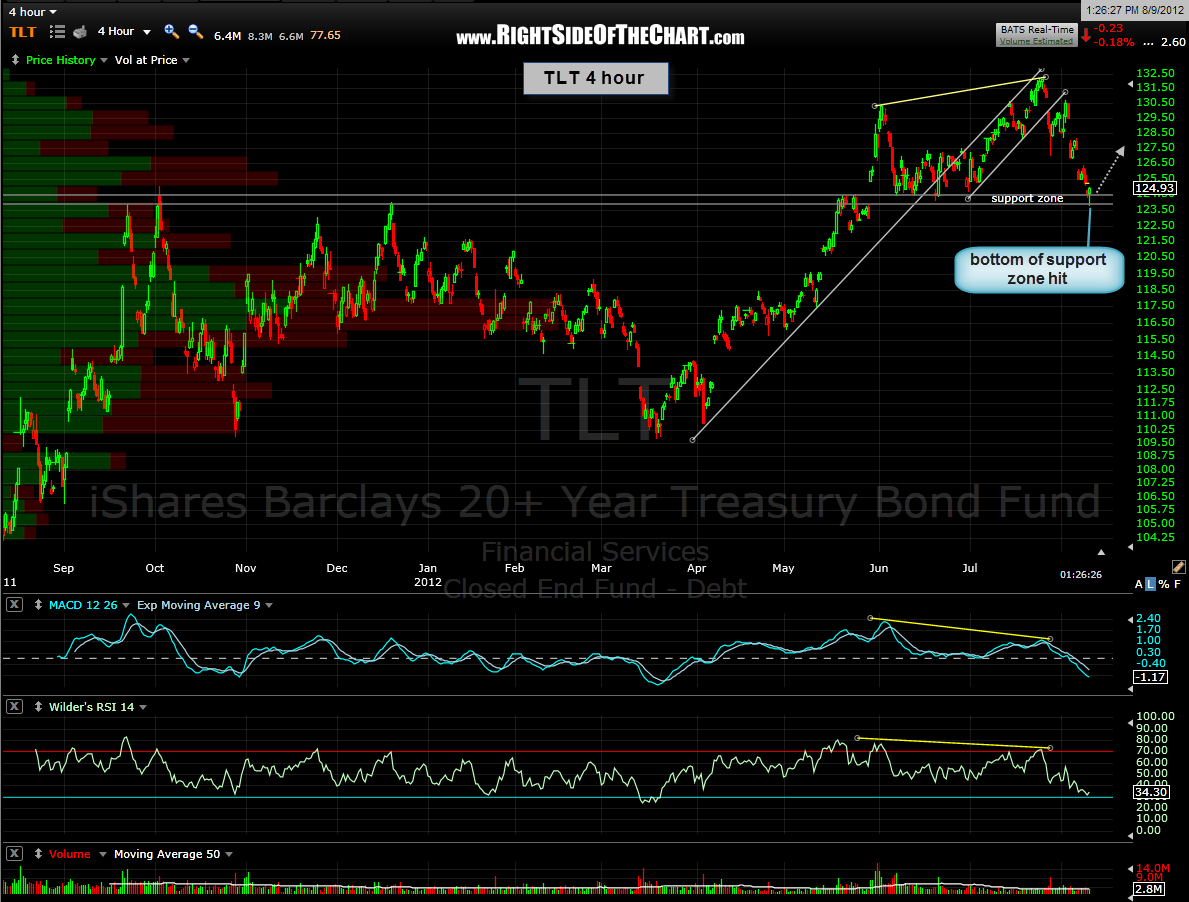
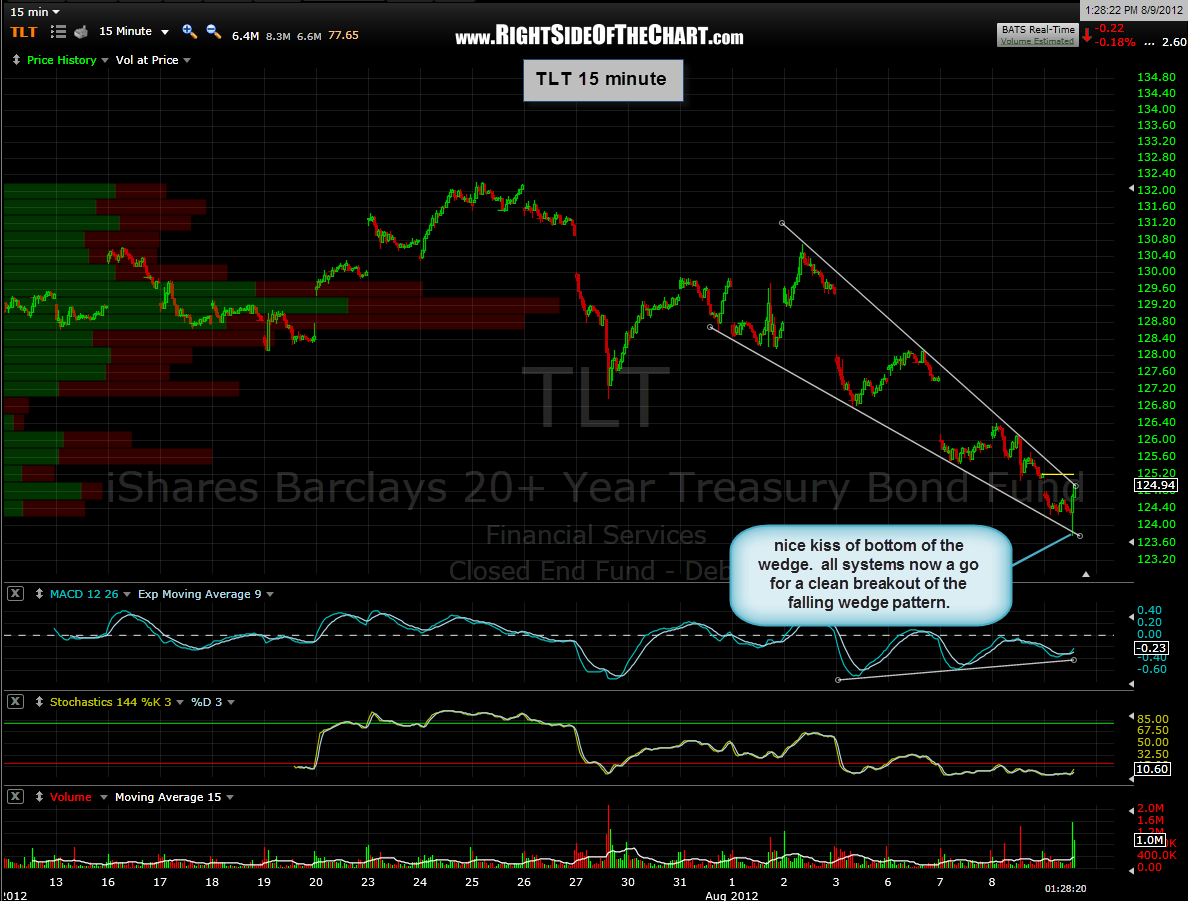
yesterday, i mentioned that i would prefer to see TLT continue moving lower to hit the 4 hour support zone before seeing the 15 minute bullish falling wedge breakout. the reason for this is that a key support level will usually act as a magnet for prices, meaning that prices often need to make a complete touch of that support level before putting in a meaningful bounce. as you can see from the charts below, we not only just got a nearly perfect tag of the bottom of that 4 hour support zone but prices also kissed the bottom of the 15 minute bullish falling wedge on that spike down as well.
nothing is ever 100% in trading but i would now put good odds on TLT prices moving higher from here, which conversely, should mean equity prices lower. of course, TLT could flounder around for a while before moving higher and possibly want another test of that support line. prices could also break down below support, which would be bearish for TLT and bullish for equities. however, my primary scenario for now is TLT up from here and equity prices lower, even if they lag behind the reversal in TLT for a bit first. primary target for TLT is 127.40. updated 15 min & 4 hour charts: