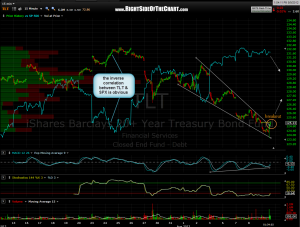
 here’s the updated 15 minute TLT chart showing that prices broke above the falling wedge shortly after the last post. i’ve also plotted the S&P 500 against TLT to highlight the inverse correlation.
on a side note: one feature that i am looking at possibly adding to the site in the future would be real-time (streaming) links to my charts. until then, it is fairly simple to replicate any of the charts that you see here. i typically use a log (aka- semi-log) scaling, which will affect how any diagonal or sloping trendlines are drawn. once you’ve set your chart to a log scaling, you can replicate these trendlines by lining them up with the wicks or bodies of the candlesticks that the trendlines touch. the time-frame on these charts is always shown just to the right of the symbol on the upper-left hand corner of the chart. replicating these trendlines will allow you to set trendline alerts to be immediately informed of pattern breakouts, price targets or stops being hit, etc… i do my best to update when the trade ideas on this site breakout, hit targets or stop levels, etc… but with the sheer number of trades posted here, i can’t possibly update or trade them all personally.

