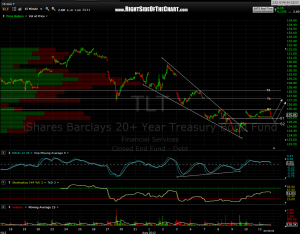
 updated TLT 15 minute chart shows how TLT has now pulled back twice after tagging the previously posted R1 level. i’ve added two support levels here, either of which are likely to launch the next wave higher once hit. either scenario is a coin-toss to me but for now, i still favor at least T1 being hit on this pattern, which should bring equity prices lower by then. for the last week or so, this market has been a playground for the HFT machines raiding the stops of both longs and shorts with near vertical rips and dips. i continue to maintain a downside bias giving my short trades some extra room on the stops for now.

