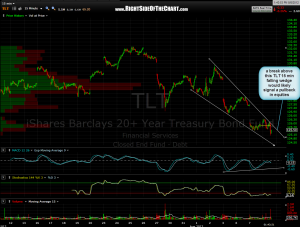
 this 15 minute chart is to be used in conjunction with the previously posted TLT 4 hour chart. a break of this bullish falling wedge would likely signal a pullback in equities. my preference would be to see TLT prices continue a little lower from here to hit at least the top of that 4 hour support zone before breaking above this 15 minute wedge. otherwise, if TLT were to move higher from here and break out soon, the odds for prices to pull back and re-test the wedge at lower levels (corresponding with the 4 hour support zone) would be fairly high. that scenario would likely lead to one more thrust higher in equities before topping. regardless, something to monitor.

