
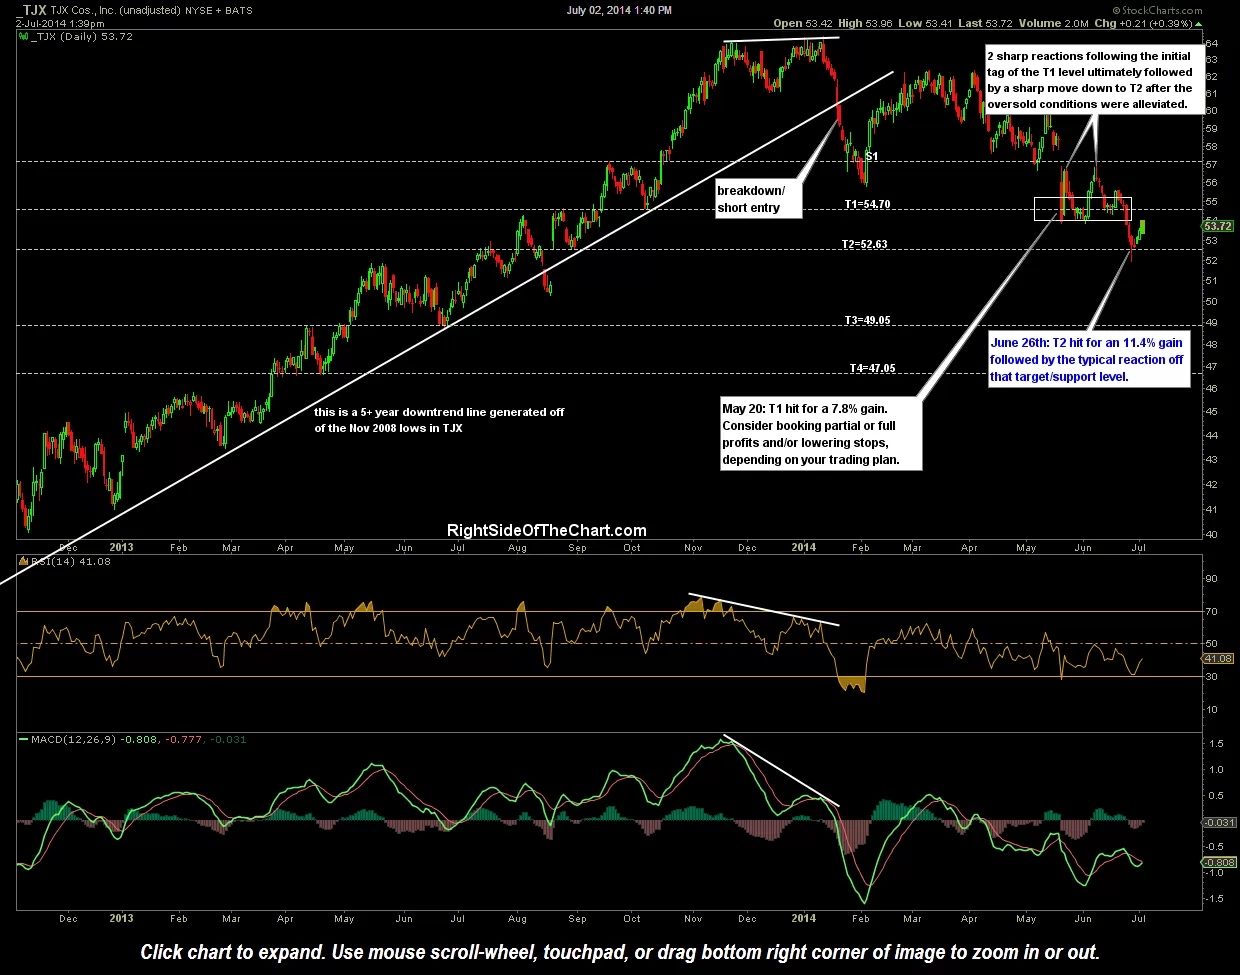
The TJX (TJX Companies) active short trade hit the second price target of 52.63 on Thursday for an 11.4% gain from entry. TJX is a good example of how most trades experience a reaction (i.e.- a counter-trend bounce and/or a temporary consolidation around that level) upon the initial tag of each target. As this updated daily chart highlights, TJX experienced a very sharp bounce immediate after the first price target was hit back on May 20th. Prices then fell back towards the T1 area for a few days before one additional sharp spike up towards the 56.85 level. From there, prices again fell back to the T1 area (still support) for a few trading sessions before finally making a impulsive drop down to the T2 level, on which prices put in a hammer (reversal candlestick), moving higher since then. With positive divergences in place when T2 was hit in addition to the stock at oversold readings on the daily time frame, once again TJX may need some time to work off the overbought conditions before resuming the downtrend and continuing down towards the next price target (T3 at 49.05) and ultimately towards the final target of 47.05. Updated daily & weekly charts below.
Click here to view the live, annotated daily chart of TJX
-
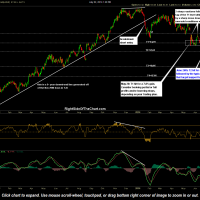
- TJX daily- T2 Hit
-
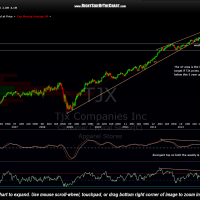
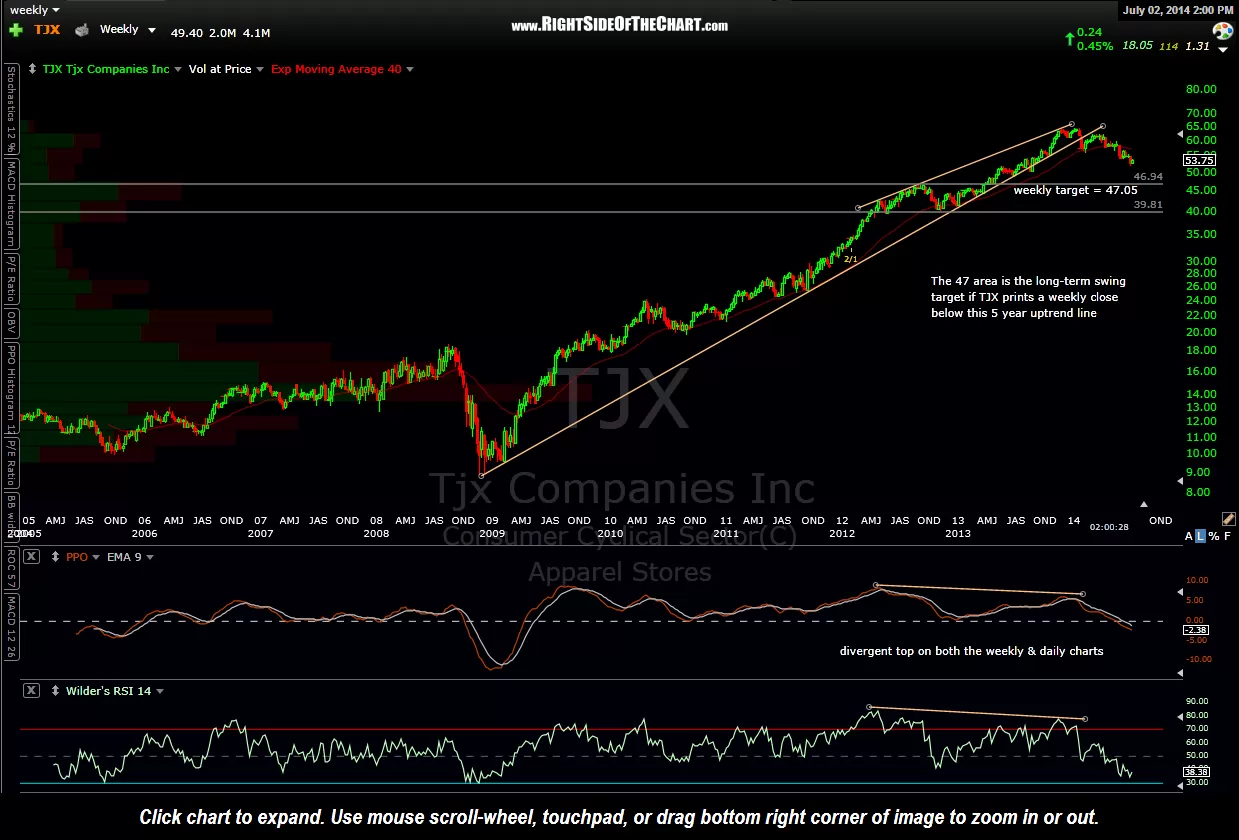
- TJX weekly July 2nd
As with any trade idea posted on RSOTC, all previous notes and charts on a specific trade can be quickly referenced via the tagging system. At the bottom right-hand corner of each post, simply click on the ticker symbol of the trade being discussed (Tagged with: TJX) and all posts related to that ticker symbol will be shown in reverse chronological order. Another option would be to use the “Select Ticker” drop-down box on the sidebar of the home page.