
TJX was recently added as a Active Short Trade just over a month ago on June 24th as it was breaking below this long-term uptrend line. That proved to be a one-day (or less) wonder as TJX immediately did an about face and closed back above the trendline that same day, therefore giving us a “fake-out” instead of a break-out (or break-down). As the suggested stop was listed as a move above 51.20 and TJX did just recently exceed that level by roughly 3%, I will consider that trade stopped out and moved to the Completed Trades Category. However, TJX will also be added back as a new Short Setup today with a short entry to be triggered on a breakdown of the primary uptrend line.
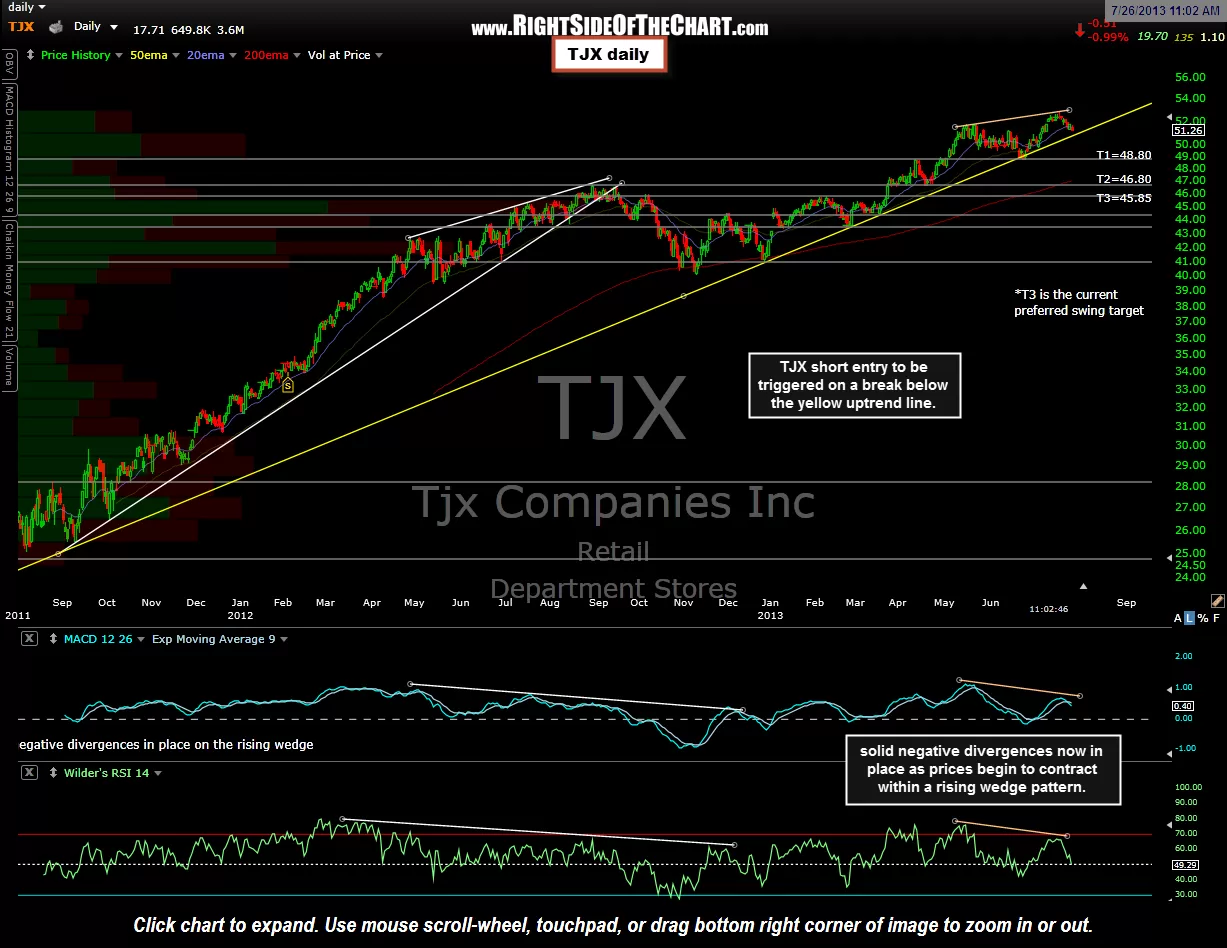
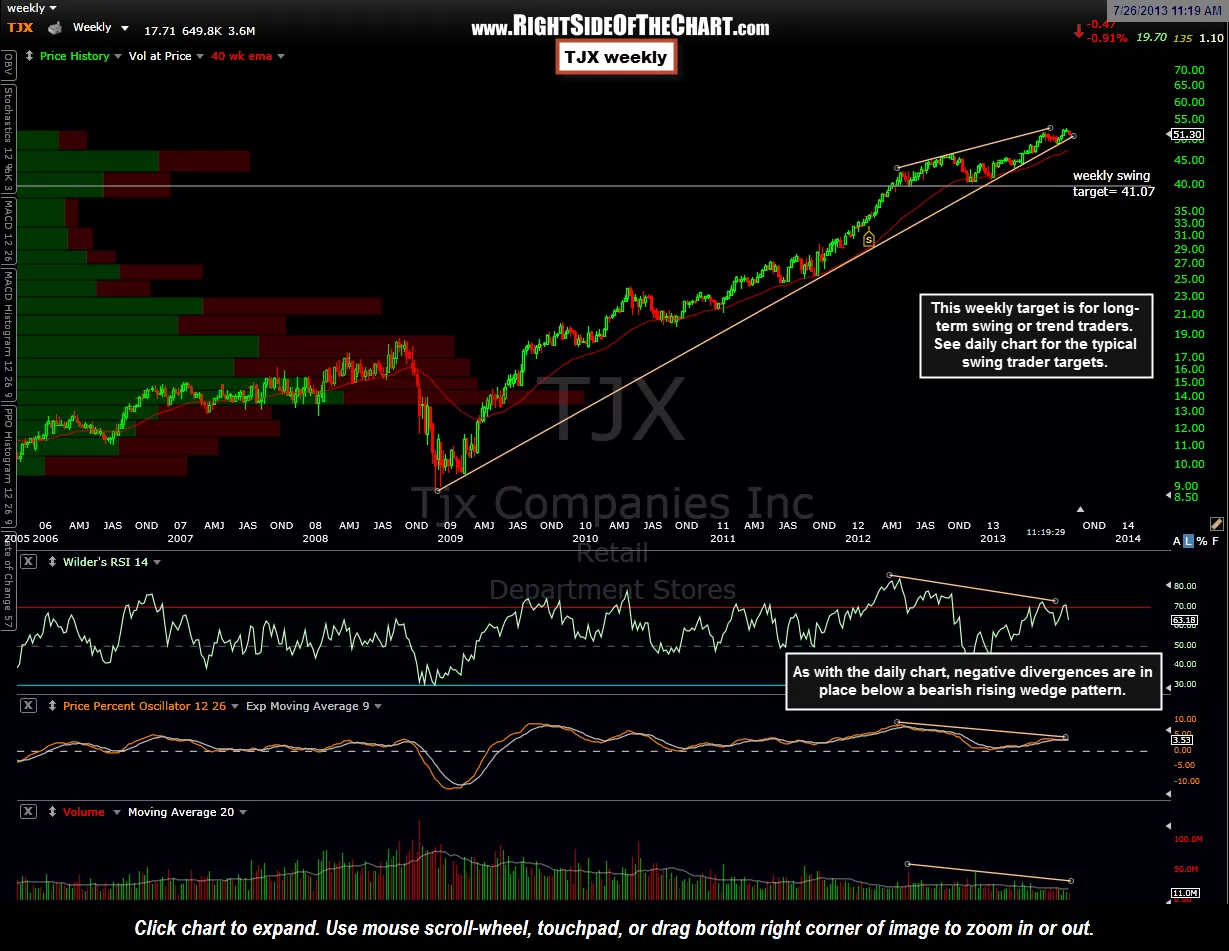
The new short entry will again be on a break of that long-term uptrend line, shown on both the daily & weekly charts above. As the stock has moved higher since that previous post last month, I have modified the price targets. As we don’t yet know our entry price (TBD upon a break below the uptrend line), I can’t give a suggested stop level until an entry is triggered. Something worth noting is that when we had that false breakdown last month, notice how there wasn’t any divergences on the daily chart whereas now, we have solid negative divergences on both the daily RSI & MACD. This greatly increases the odds that a breakdown below that uptrend line, especially following a daily close below, will lead to a significant correction. Of course, the success, or lack thereof, of any short or long trades is largely predicated on the broad market moving in tandem with the trade.