Member @raider74 asked for an update on AAPL (Apple Inc.) within the trading room & as Apple is one of the most widely held & followed stocks, I figured that I’d share my thoughts here on the front page for all to see.
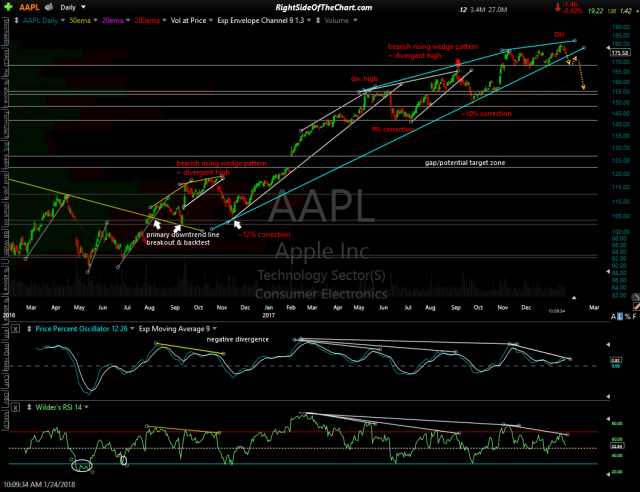
In this post from January 24th, I highlighted the fact that AAPL was poised for a breakdown below a very well formed & fully mature bearish rising wedge pattern complete with negative divergences (first chart below) as well as calling for a drop of at least 14% from the recent highs. Apple went on to break down below the wedge the very next day with an impulsive red candle which helped to confirm the breakdown & has continue to fall since. While the breakdown of the rising wedge & primary uptrend line has longer-term bearish implications, my thoughts on the near-term direction of the stock are mixed but should become more clear by the end of next week.
- AAPL daily Jan 24th
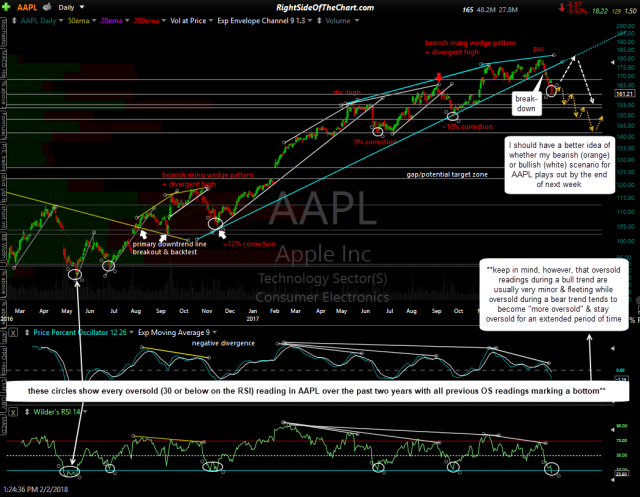
- AAPL daily Feb 2nd
click on any chart to expand
There’s a lot of moving parts in the daily chart above. Besides the recent breakdown & impulsive selling, AAPL has now reached an oversold reading below 27 on the daily RSI. As the updated chart above highlights, all previous oversold readings for at least the past two years (shown here) marked major bottoms in the stock. However, the evidence of a major top in AAPL is building so if the January 18th divergent high in Apple was THE top & not just a temporary top with the stock soon heading to new highs, then one should be aware that oversold readings during a bull trend are usually very minor & fleeting (such as the previous 5 circled on that chart) while oversold during a bear trend tends to become “more oversold” & stay oversold for an extended period of time. As such, those that believe this correction is just another buying opp on the path to new highs should welcome this pullback & take advantage of this rarely seen overbought reading to buy AAPL while those that aren’t sure or those that believe the recent drop is merely the start of a much deeper correction or new bear market might opt to hold onto a short position (if already short) or look to add or initiate a new short position on the next counter-trend bounce back to resistance.
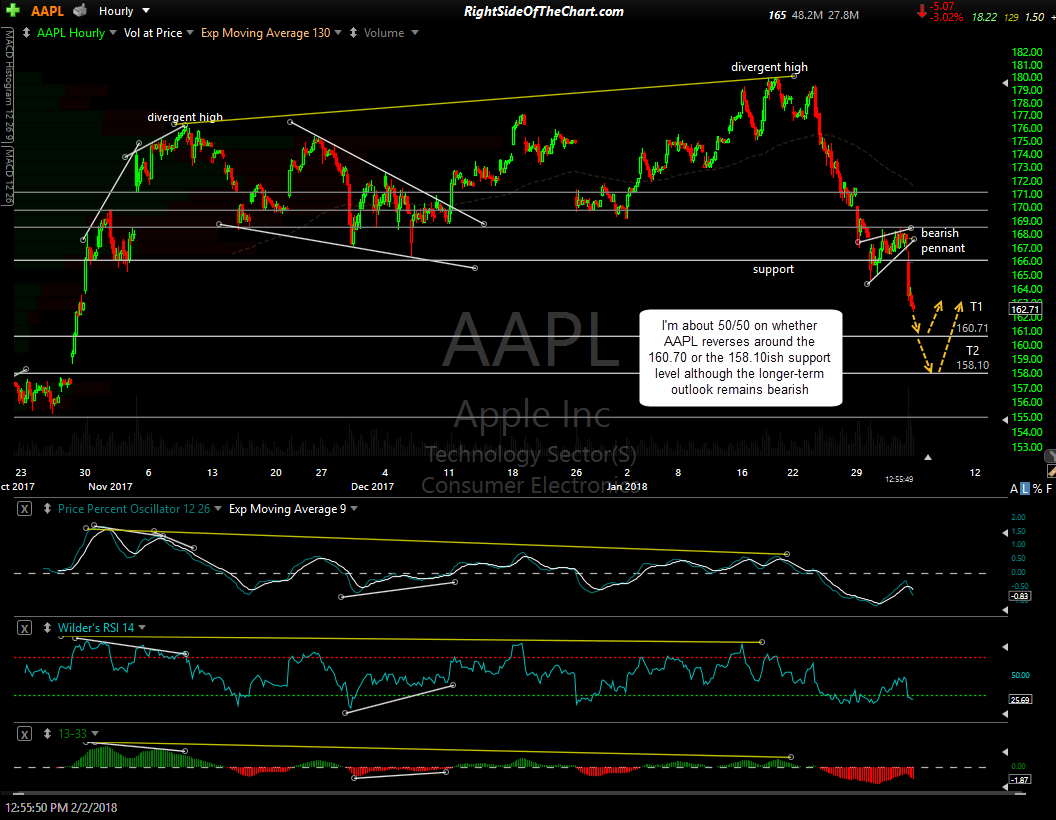
Zooming down to the 60-minute time frame on the chart above, AAPL recently broke down below a bearish pennant continuation pattern & appears headed to either the 160.70 or the 158.10 support level before a meaningful reversal. The bigger picture can be viewed on the weekly chart below. Again, lots of moving parts but the salient developments are the steep negative divergences in place on the weekly momentum indicators (RSI & PPO), with all such previous divergences preceding bear markets (i.e.- drops of 20%+); the impulsive breakdown below the current uptrend line which, at this point, is almost certain to be finalized with a weekly close by 4pm today; and finally, the third & one of the most important factors that I use to determine the primary trend (bullish or bearish) in AAPL is the 40-week exponential moving average. The 40-week EMA (same as the 200-day EMA) has done an excellent job of defining bull & bear market in the stock, bullish when trading above the 40-week EMA, bearish when below. As that trend indicator is based off the weekly chart, I need to see a weekly close below the 40-ema. As I type, AAPL is trading about 1½% above that level.
The bottom line is that someone bullish could certainly make a case to buy Apple at or near current levels while those bearish could make a decent case for a longer-term short position. However, being is such close proximity to that key 40-week/200-day EMA as well as the fact the stock is oversold on the daily time frame with bullish divergence building on the 60-minute chart as the stock approaches support, I favor a tradable bounce in AAPL at or near either of those targets posted on the 60-minute chart above. If that does pan out, I will monitor the charts closely to gauge just how far that bounce might go to close any long bounce trade as well as if & where initial a short position for the next leg down.


