
Member @smithhali in the trading room has requested a chart opinion on BNS (Bank Of Nova Scotia) with the intention of looking for an objective level to take a long position, should the stock experience a correction in the coming months. Last week I had noticed an interesting disparity in recent weeks between the major US banks & the major Canadian banks & was planning to publish an update on the Canadian banks so I’ll post it here for anyone else interested as it appears that the next correction in the Canadian banks might have just recently started.
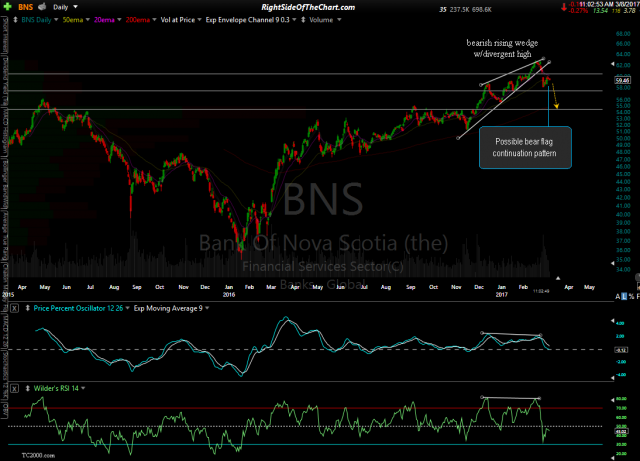
Following the recent divergent high & breakdown below this bearish rising wedge pattern, BNS appears headed to at least the 60.50 level & quite possibly the 54.50 level in the coming months, should the Canadian & US stock markets begin to correct. Should BNS start to approach the 60.50, I will have to reassess the charts of the broad market, Canadian banking sector as well as BNS in order to determine if that will be the likely end point for a correction or just a bump along the way to the 58 level & possibly the 54.50 level.

BNS daily Dec 18th
TD (Toronto Dominion Bank) has some bullish divergences on the 60-min chart which could lead to a little more upside on this counter-trend bounce but following the recent divergent high & bearish rising wedge breakdown on this daily time frame, the stock appears headed down to at least the 54.75 area & quite possibly the 52.70 area in time.
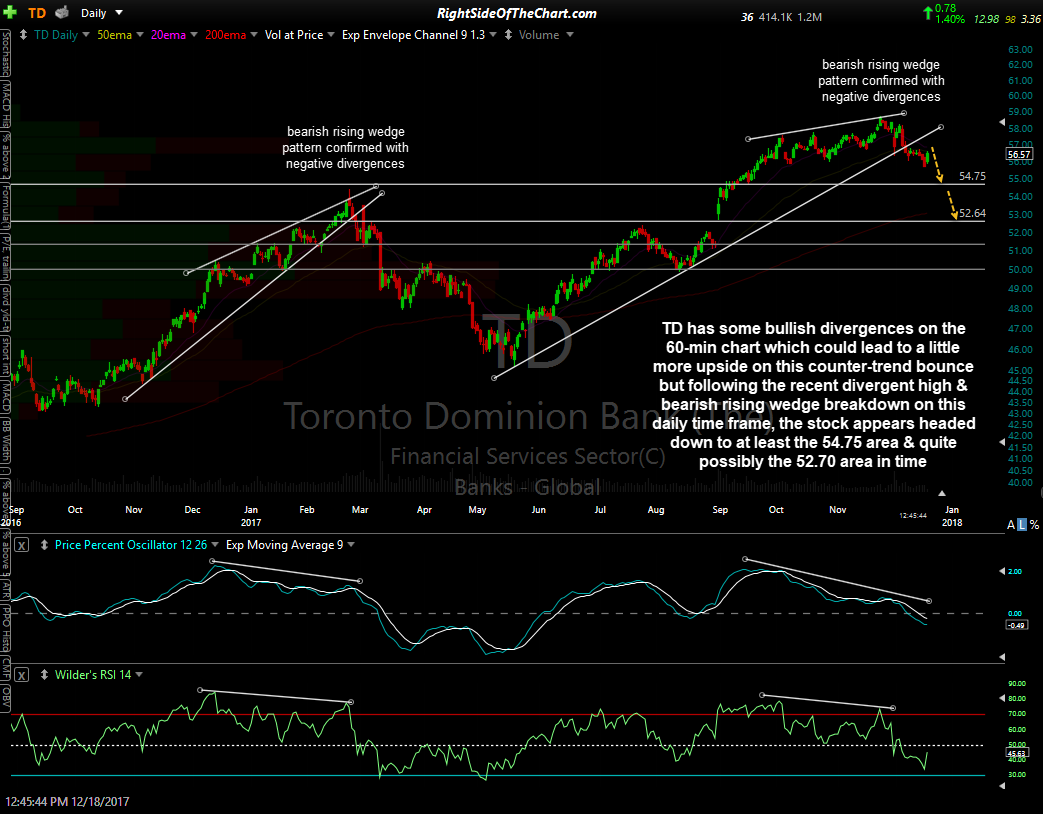
TD daily Dec 18th
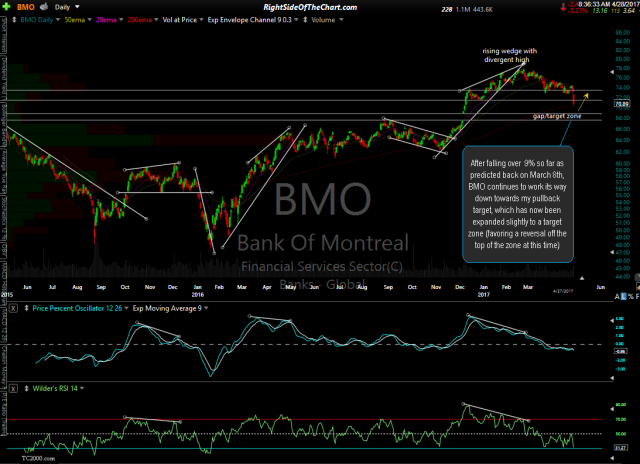
My primary scenario has BMO (Bank Of Montreal) breaking out above the 79 resistance level/new highs which will prove to be a bull trap with the breakout failing, followed by a reversal down to at least the 76.50 level although whether or not that occurs, a break below the bottom of the wedge pattern will trigger a sell signal.
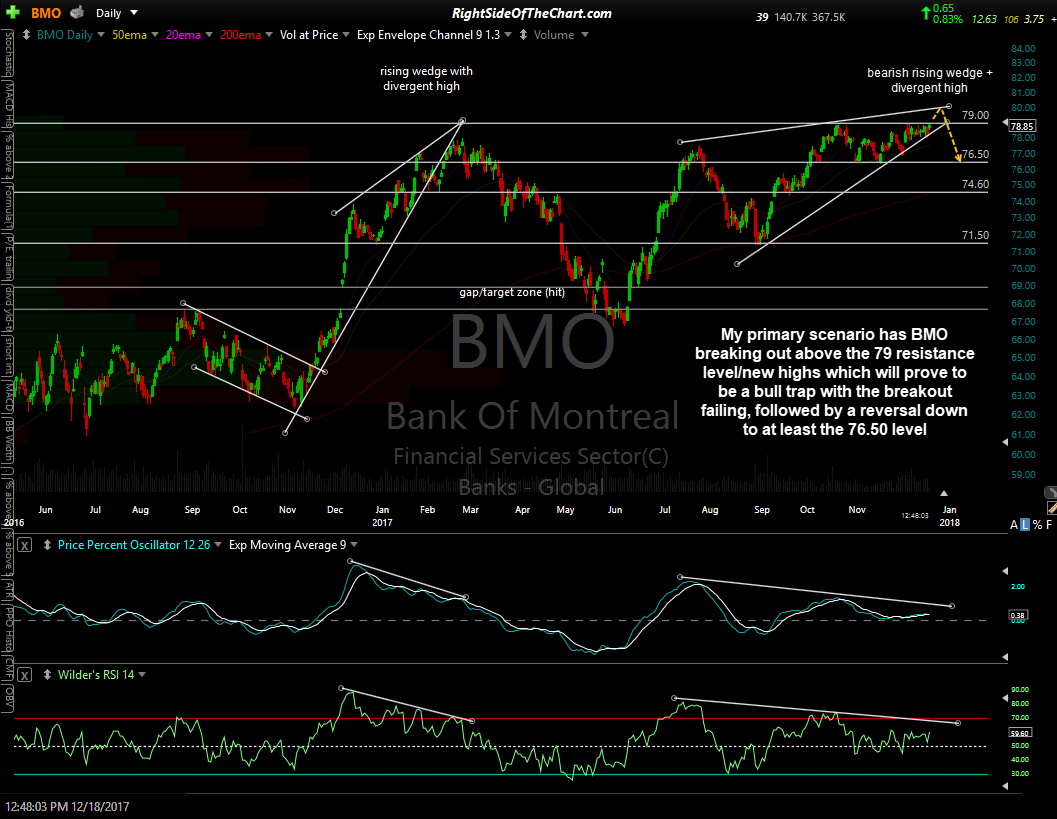
BMO daily Dec 18th
As I stated in the trading room, I’ve noticed a start divergence between these big Canadian banks & their US counter-parts since all the buzz about the US tax law changes in recent weeks with the US bank stocks rallying sharply while the Canadian banks have clearly sold off. My guess would be that this is a reflection of the competitive landscape changing (lower tax rates for US banks) with money flowing out of Canadian banks into US banks.
Only time will tell whether or not that trend will continue but I can say that the charts of these 3 leading Canadian banks stocks appear similar to how they did earlier this year just before they experienced their biggest drop in years as was predicted back on March 8th, shortly after they all topped (click here to view those charts & see those previous charts below:
-
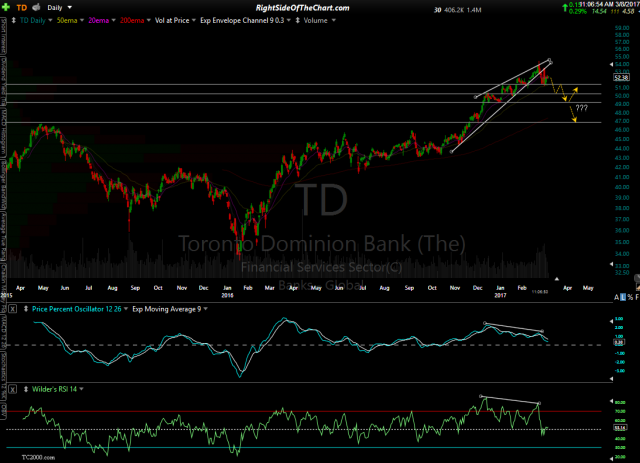
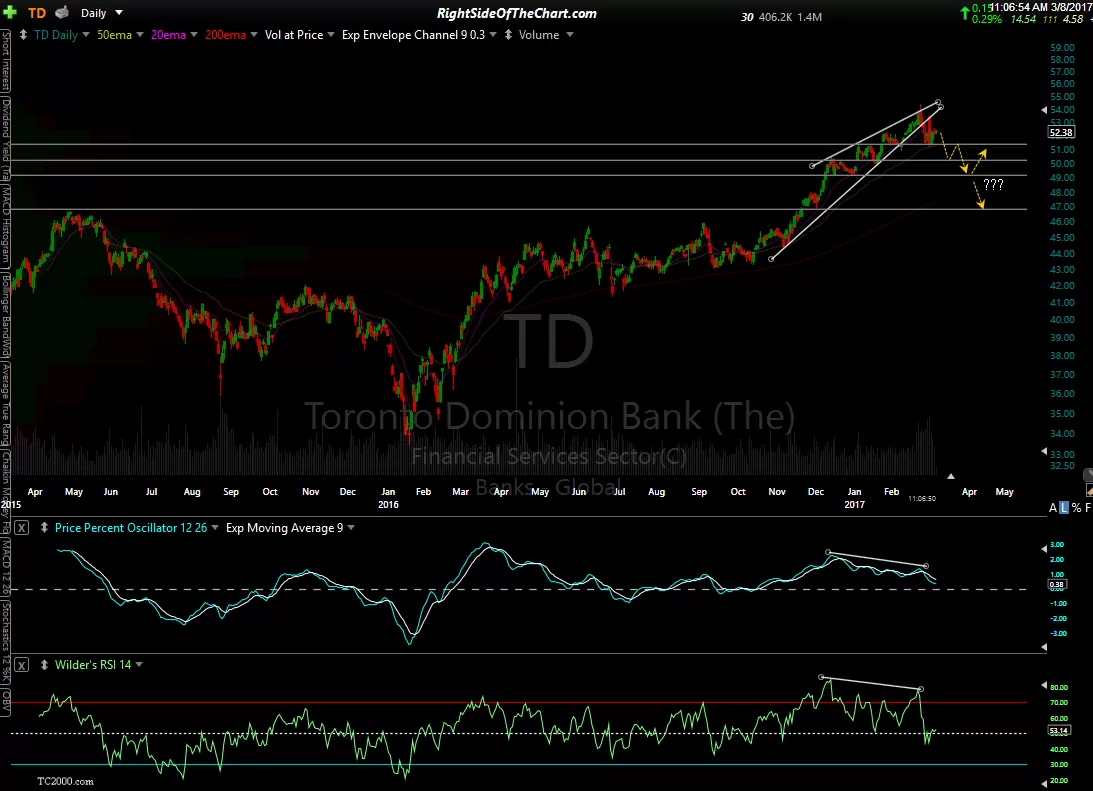
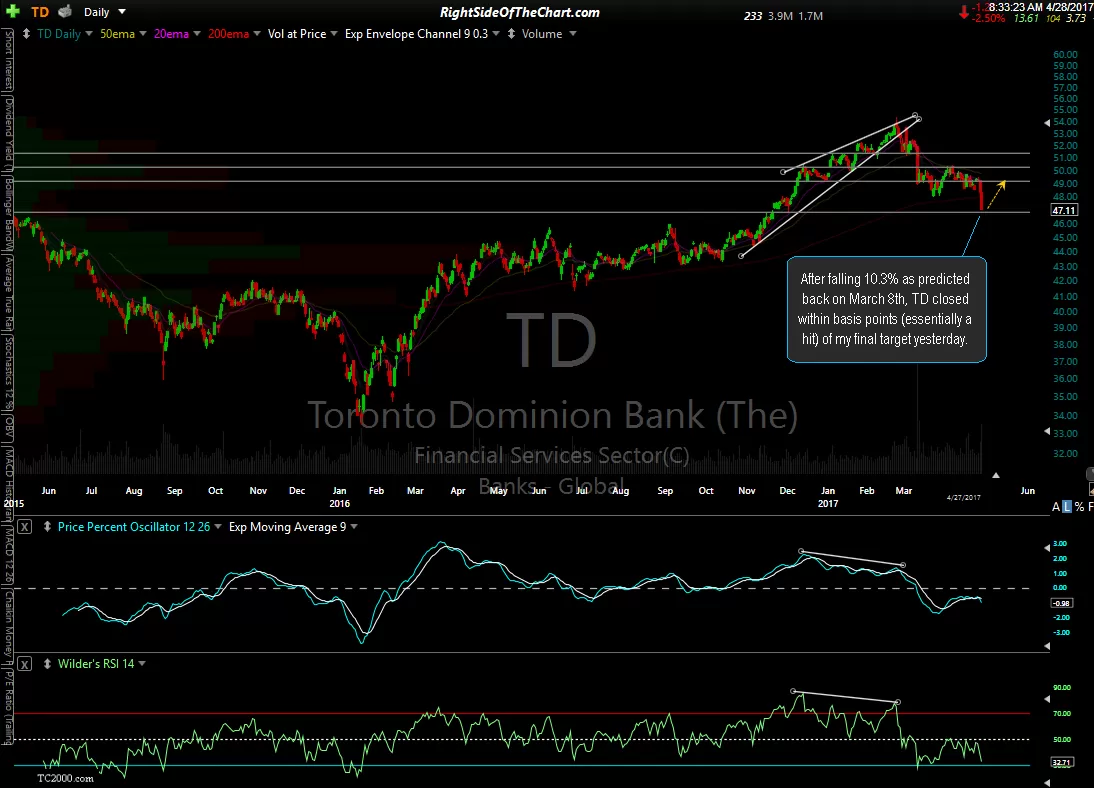
- TD daily March 8th
-
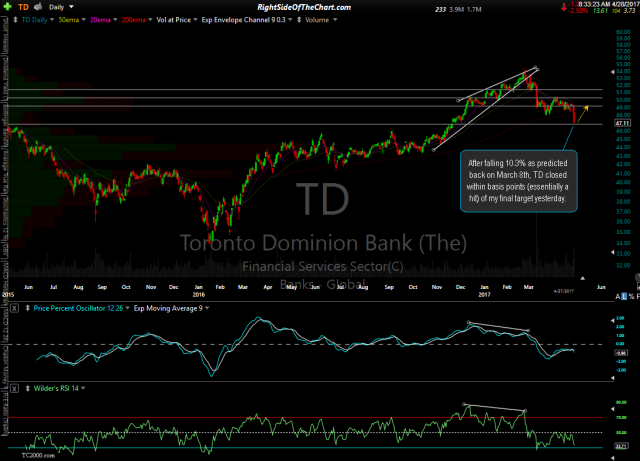
- TD daily April 27th close
-
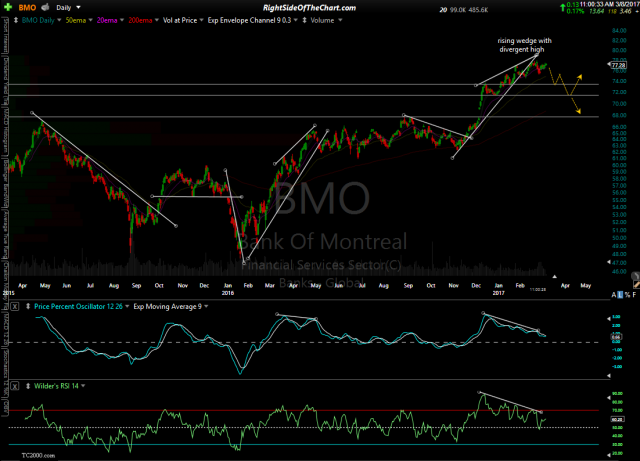
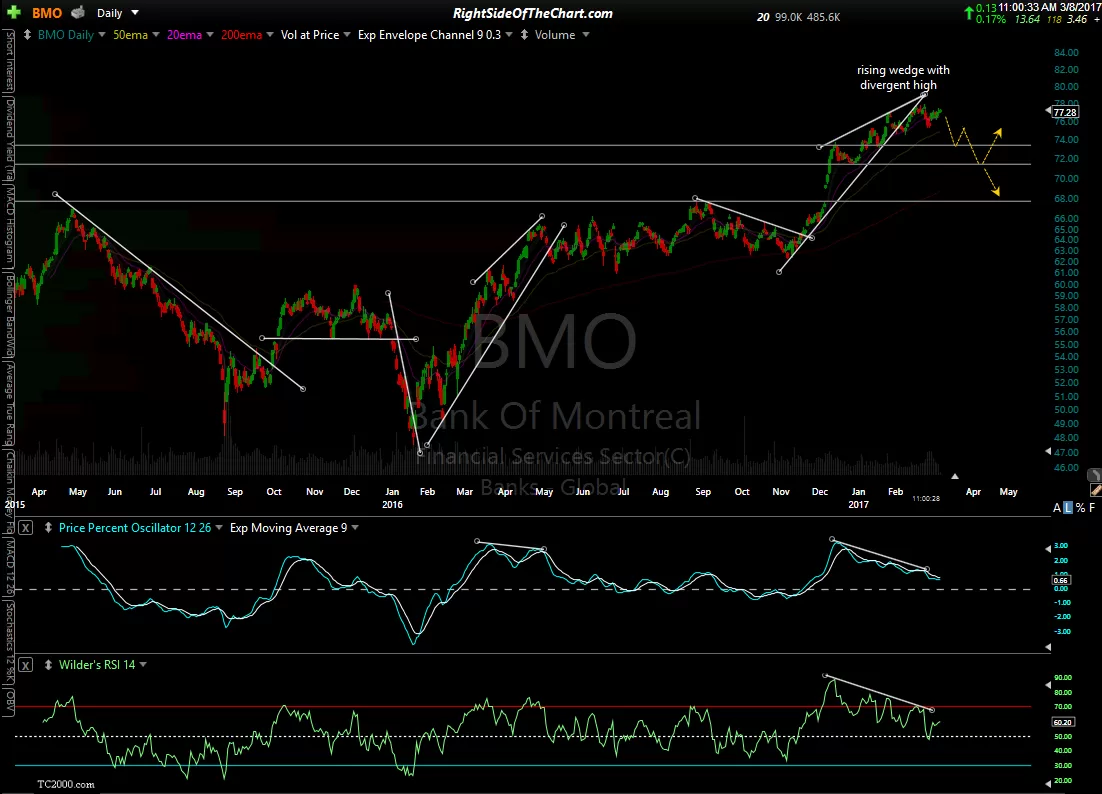
- BMO daily March 8th
-
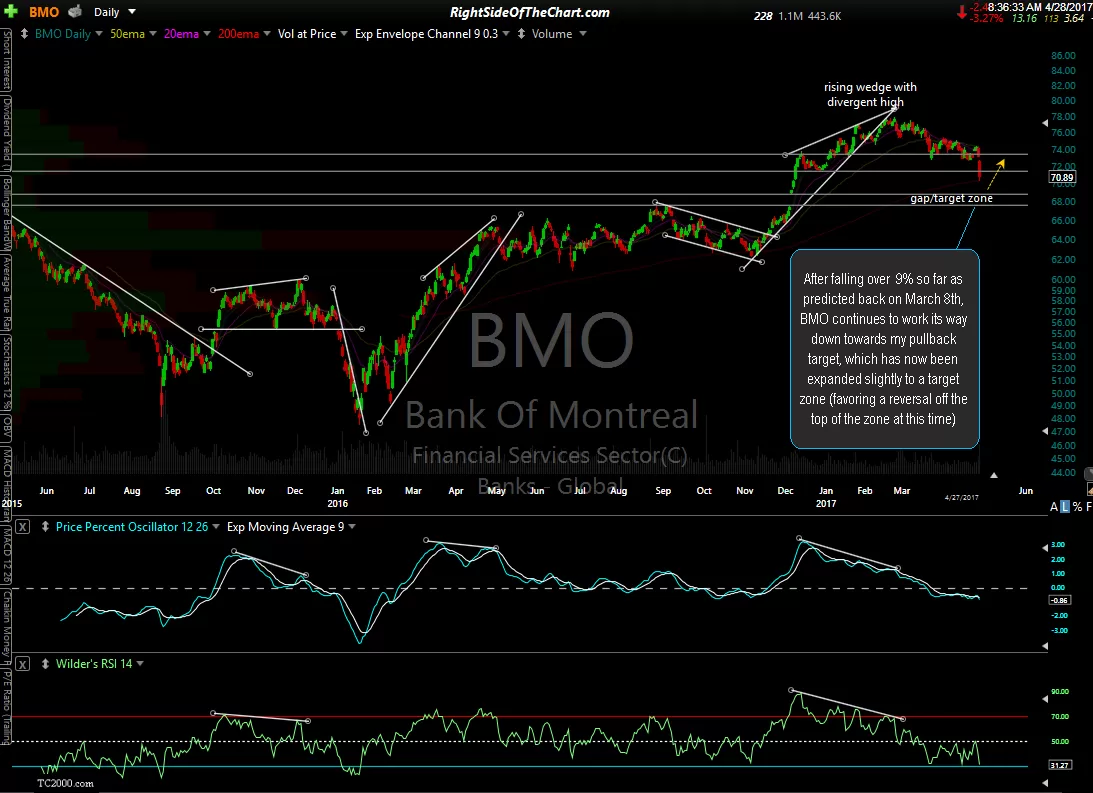
- BMO daily April 27th
-
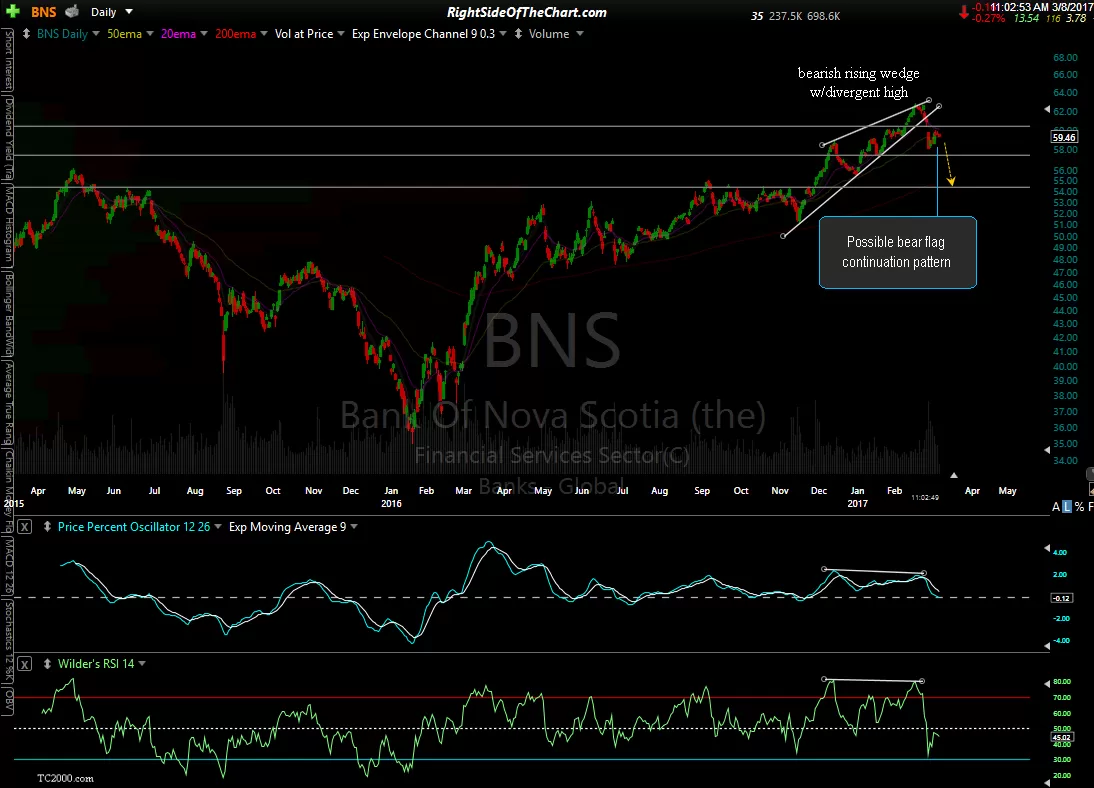
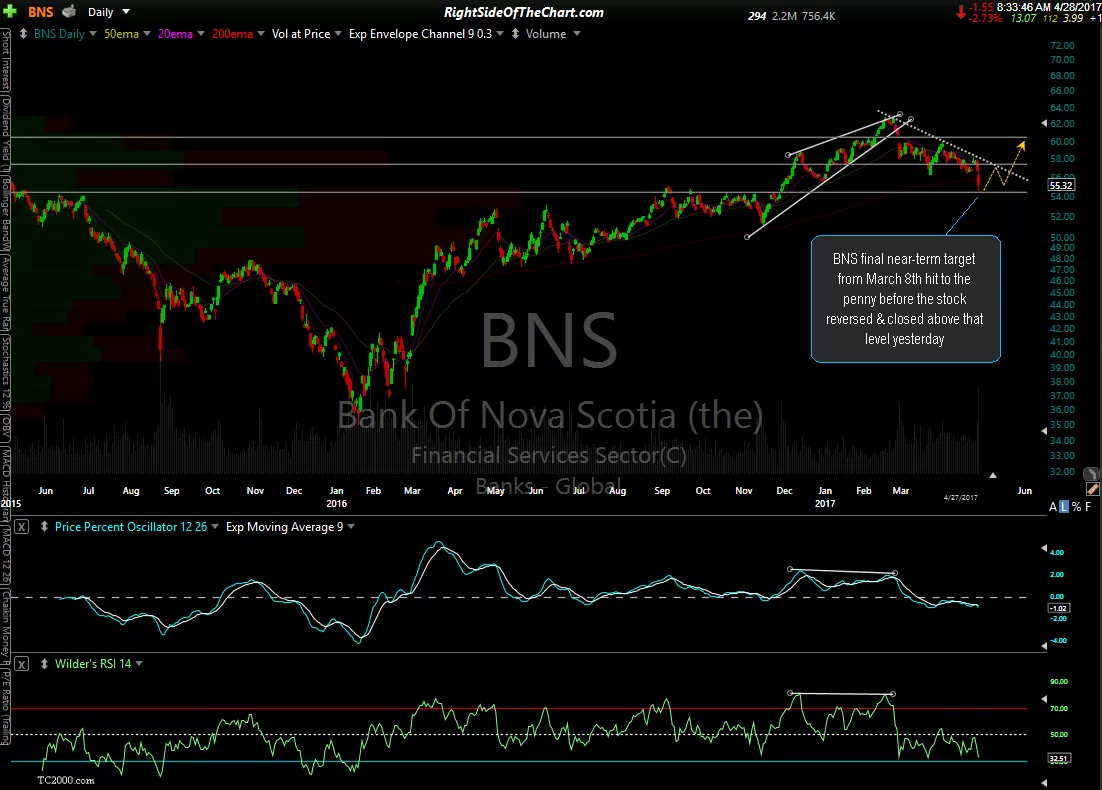
- BNS daily March 8th
-
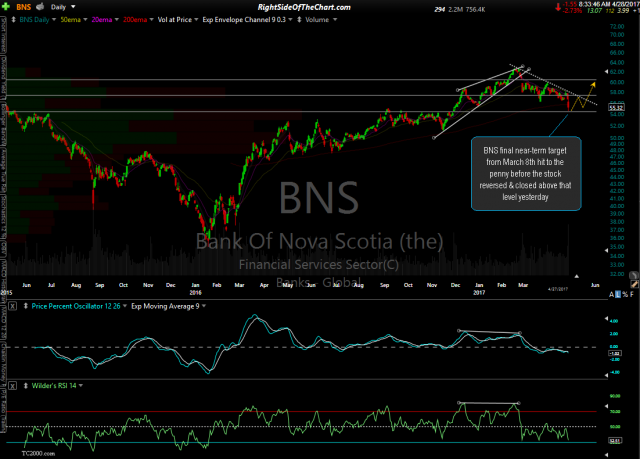
- BNS daily April 27th close
Note: If you would like a chart with price targets, support & resistance levels on any of the Canadian ($TSX) listed shares of these banks post a request in the trading room or in the comment section below this post.