
TLT (20-30 year Long-term US Treasury bond ETF) appears to be in the process of a near-term buying climax and along with some other technical developments noted on the 60-minute chart below, appears likely poised for an imminent pullback.
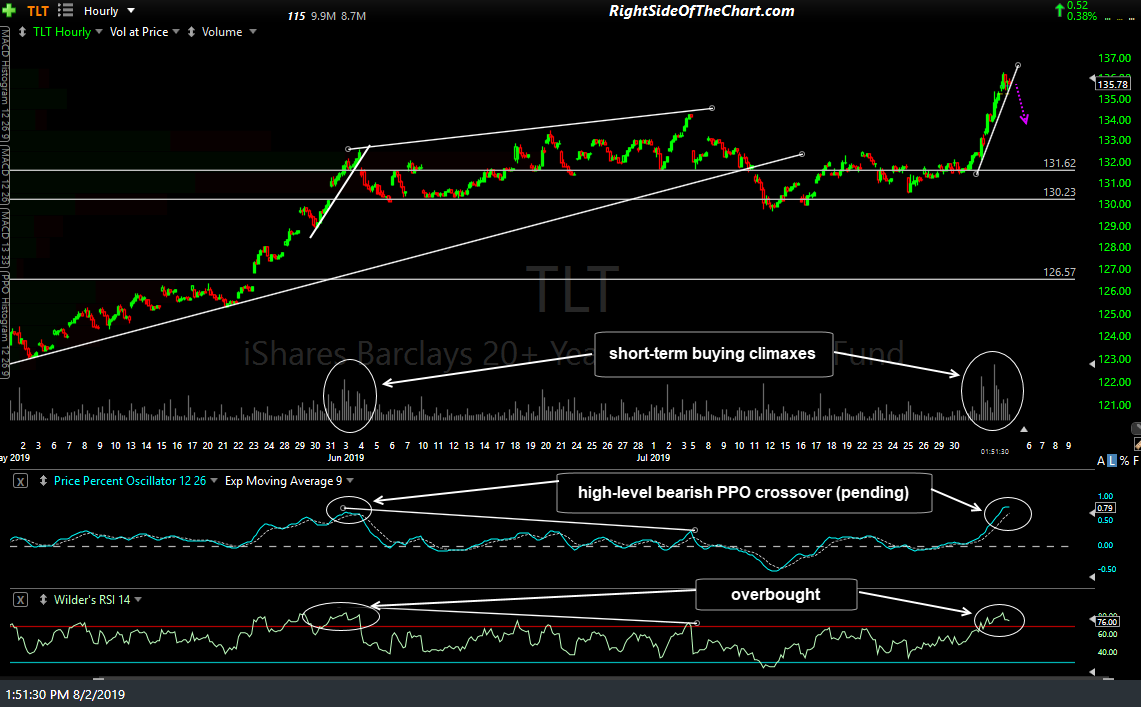
TLT 60-min Aug 2nd
The 60-minute chart of TBT (2x short Long-term US Treasury Bond ETF) is essentially a mirror image of TLT & also appears poised for at least a small bounce of about 2-4½% & possibly more. While this is certainly a counter-trend trend, which increases the odds that it may not pan out as we don’t yet have any decent sell signals on long-term Treasuries, I believe that the R/R is attractive enough to warrant a long swing trade on TBT. As such, TBT will be added as an Active Short Swing Trade (although keep in mind that you would BUY, not short or ‘sell-short’, TBT, for a short on L/T Treasuries, which this trade is, hence it will be assigned to the ‘Short Swing Trade’ category.

TBT 60-min Aug 2nd
I will also add that a pullback in Treasuries doesn’t particularly align with a sharp drop in the stock market from here so if equities continue to sell off impulsively in the coming days to weeks without a decent snap-back rally, that would likely, but not necessarily, provide a headwind for a short trade on US Treasury Bonds, as they are typically a flight-to-safety asset class which tends to rally during stock market corrections.
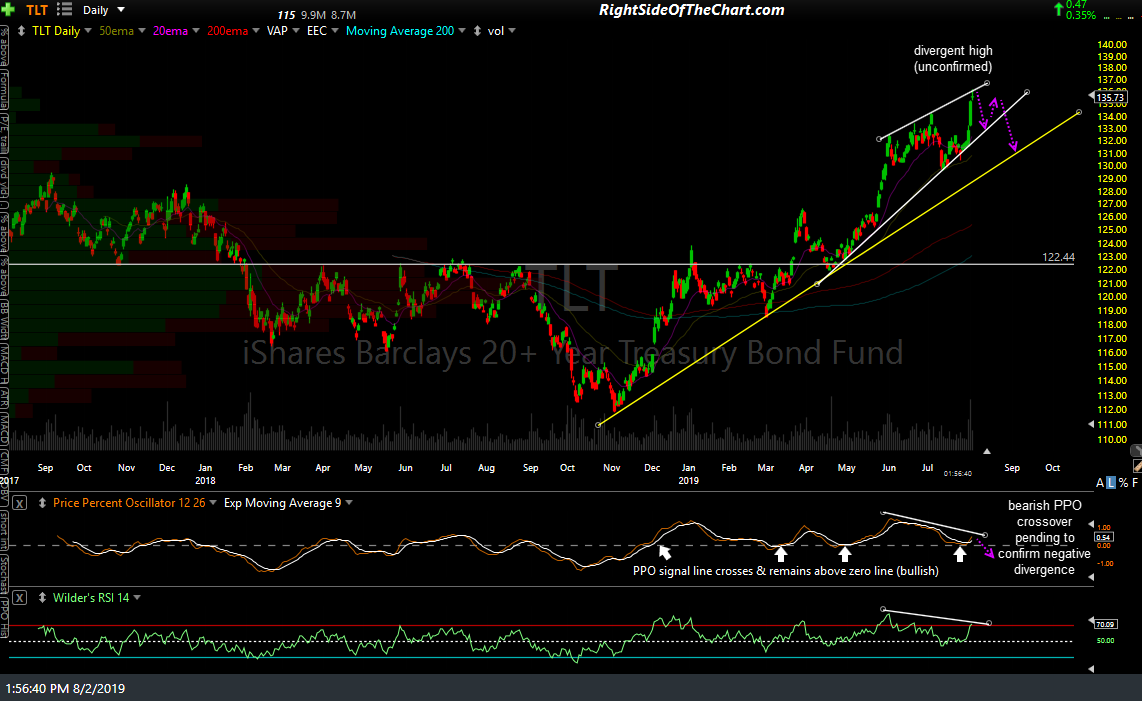
TLT daily Aug 2nd
Again, usually is not the same as always and additionally, the major stock indices as well as several market-leading stocks (as per today’s mid-session market update video) has fallen to significant support levels while near-term oversold & as such, the stock market could bounce from here, providing a headwind for Treasury Bonds. Either way, this is just one piece of the pie of a diversified portfolio & more so, just a tactical, quick pull-back trade at this time although there is certainly the potential for a much larger drop in the longer-term charts of TLT. Therefore, depending on how the charts develop going forward & assuming this trade isn’t stopped out before then, additional price targets may be added to this trade.
The price targets for TBT, as shown on the 60-minute chart at the top of the page, are T1 at 28.06 & T2 at 28.56. The suggested stop is 26.97 and the suggested beta-adjusted position size is 1.0. That position size takes into account the 2x leverage factor of TBT which is then offset by the fact that Treasury Bonds are inherently low-volatility securities, rarely gaining or falling more than 2% in a single day which therefore allows for a larger position size when compared to a more volatile security such as SPY or QQQ.
The gain (and loss) potential on this trade is also much smaller than many of the more aggressive unofficial trade ideas covered in recent videos so as always, pass if this trade does not mesh with your trading style, objectives & of course, outlook for the trade (TBT) itself.