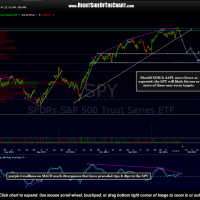
OK, a bit of a bold call & maybe a bit simplistic but based on my read of the world’s two largest publicly traded companies (and two largest components of the S&P 500 Index), XOM & AAPL, I would say that the odds for a 5% drop on the broad market (S&P 500) over the next week or so are pretty good. Calling this market down over the last year or so has been a fool’s errand (being one of those fools, I should know) but the charts are the charts and although my efforts have been focused on individual stocks and sectors lately (vs. broad market analysis), I figured that it was worth sharing these 2-hour charts and my thoughts on XOM & AAPL.
Again, maybe an overly simplistic view but the way I see it is that AAPL is poised to drop about 6% following the recent breakdown & near-backtest of this uptrend line while XOM is set to drop about 4% following its recent uptrend line breakdown & today’s backtest. Other factors go into my analysis such as the significant negative divergences preceding the recent trendline breaks on both XOM & AAPL as well as the $SPX (as shown via the SPY 2-hour chart below). With the abbreviated trading week due to the US holiday on Monday, it might take until the following week for these downside targets to be hit, assuming that my analysis is correct, but remember that stocks typically fall faster than the rise so just make sure to have your stops in place (on longs) or your favorite short setups ready to go if the selling does start to kick in next week.
- XOM 2-hour Jan 17th
- AAPL 2-hour Jan 17th
- SPY 2-hour Jan 17th


