
I recorded a video focusing on the near-term as well as longer-term technical posture & outlook for the major stock index ETFs & futures as well as the market-leading FAAMG stocks this morning. As the upload & processing at YouTube seems to be unusually sluggish today, I figured that I’d post this 120-minute chart of /NQ (Nasdaq futures) & the gist of the video which is that the technical posture & bullish divergences on the 60 & 120-minute chart of the major stock indexes & market-leading FAAMG stocks could be the catalyst for a tradable bounce before the next leg down.
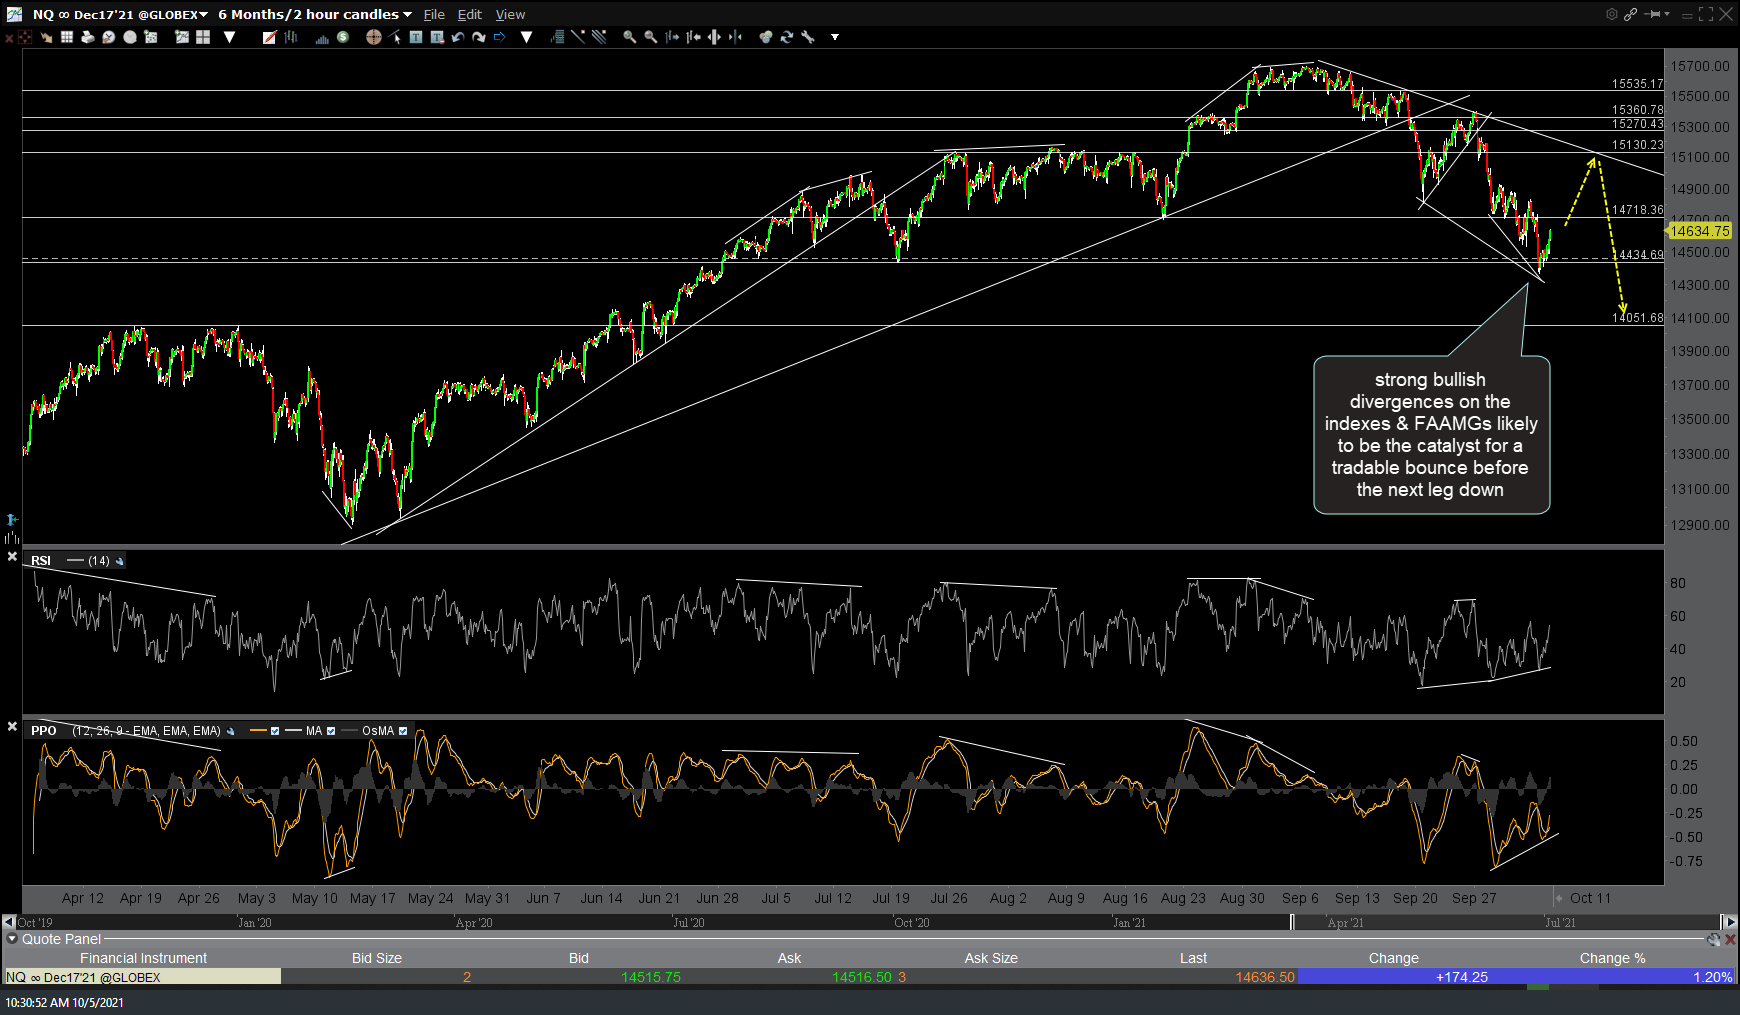
NQ 120m Oct 5th
The video will include more detail as well as some near-term bounce targets and support levels below that, if taken out, would likely spark one last thrust down to T3 on QQQ. Bottom line: I still see a very good chance of QQQ falling to T3 and the 200-day MA’s but it’s more of a matter of whether or not we get a tradable bounce before the next leg down or not.