
The website has been experiencing technical issues today due to issues/outages at the web hosting company’s servers which have prevented me from uploading or posting any charts/updates. The issues started after I had taken screenshots of the 60-minute stock index futures charts below so they reflect prices as of just before 9:00 am EST today. As soon as the issues are resolved I will post some updates on the stock indices including QQQ, SPY & IWM as well as any other securities that stand out. I wanted to get these charts out as they have the support levels in which reactions are likely (arrow breaks). Thank you for your patience.
With negative divergences in place & /NQ coming off extreme overbought readings on this 60m chart, a break below the minor uptrend lines, as well as the 8200 support (yellow line), could be the catalyst for the first half-decent pullback in weeks.

NQ 60m Dec 2nd
With negative divergences in place & /ES coming off extreme overbought readings on this 60m chart, a break below the minor uptrend lines, as well as the 3100ish support (yellow line), could be the catalyst for the first half-decent pullback in weeks.
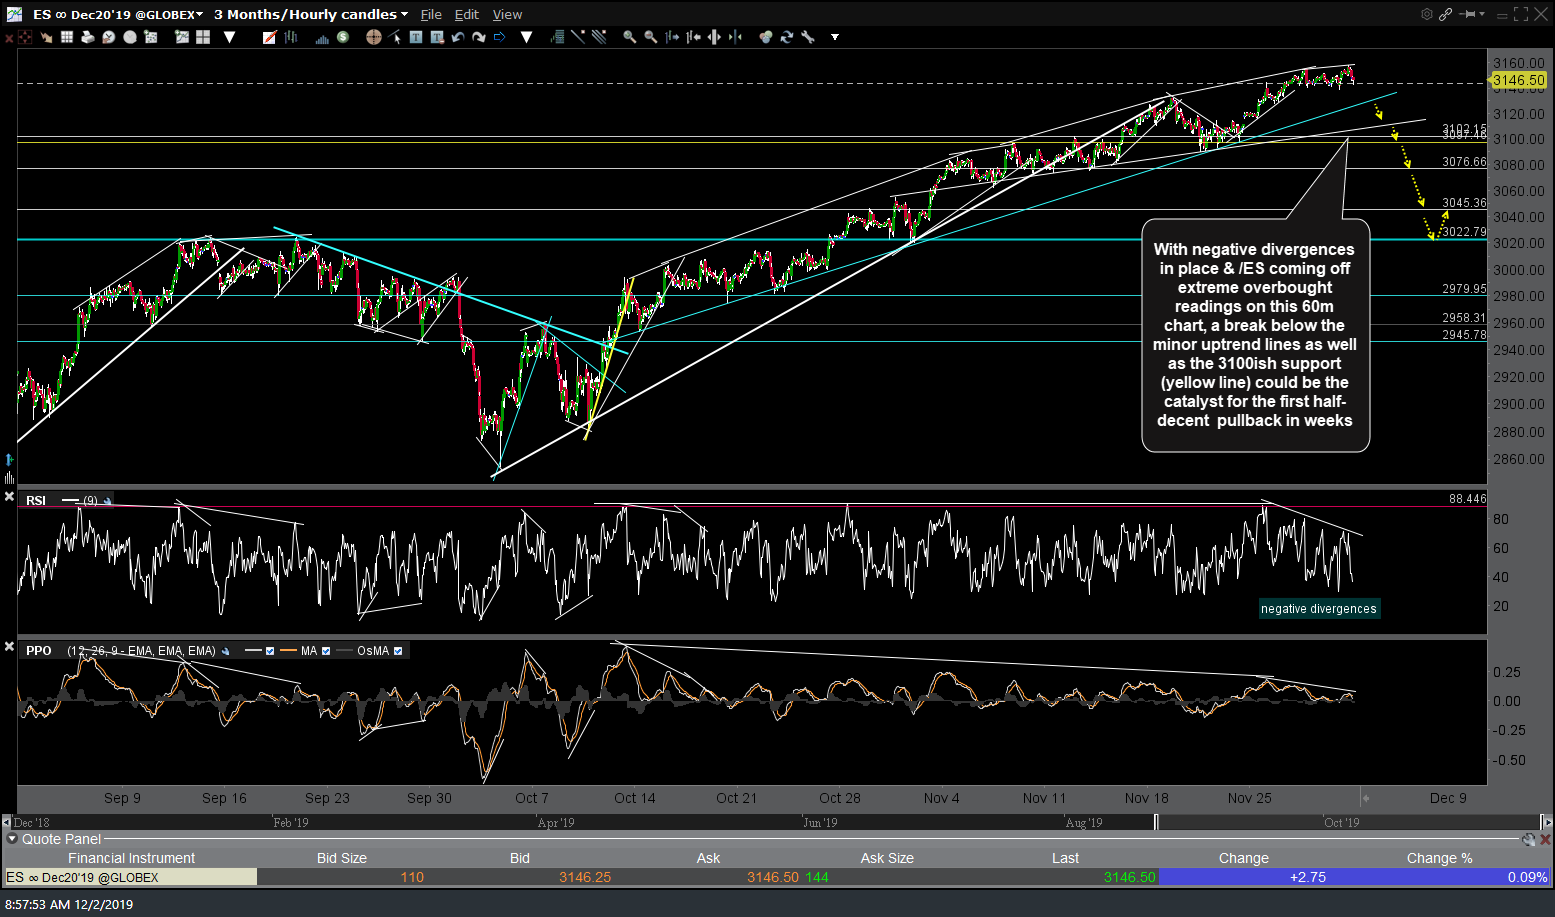
ES 60m Dec 2nd
/RTY has negative divergence along with the large-cap indices which could be the catalyst for a pullback to the 1600ish & 1580ish support levels this week.
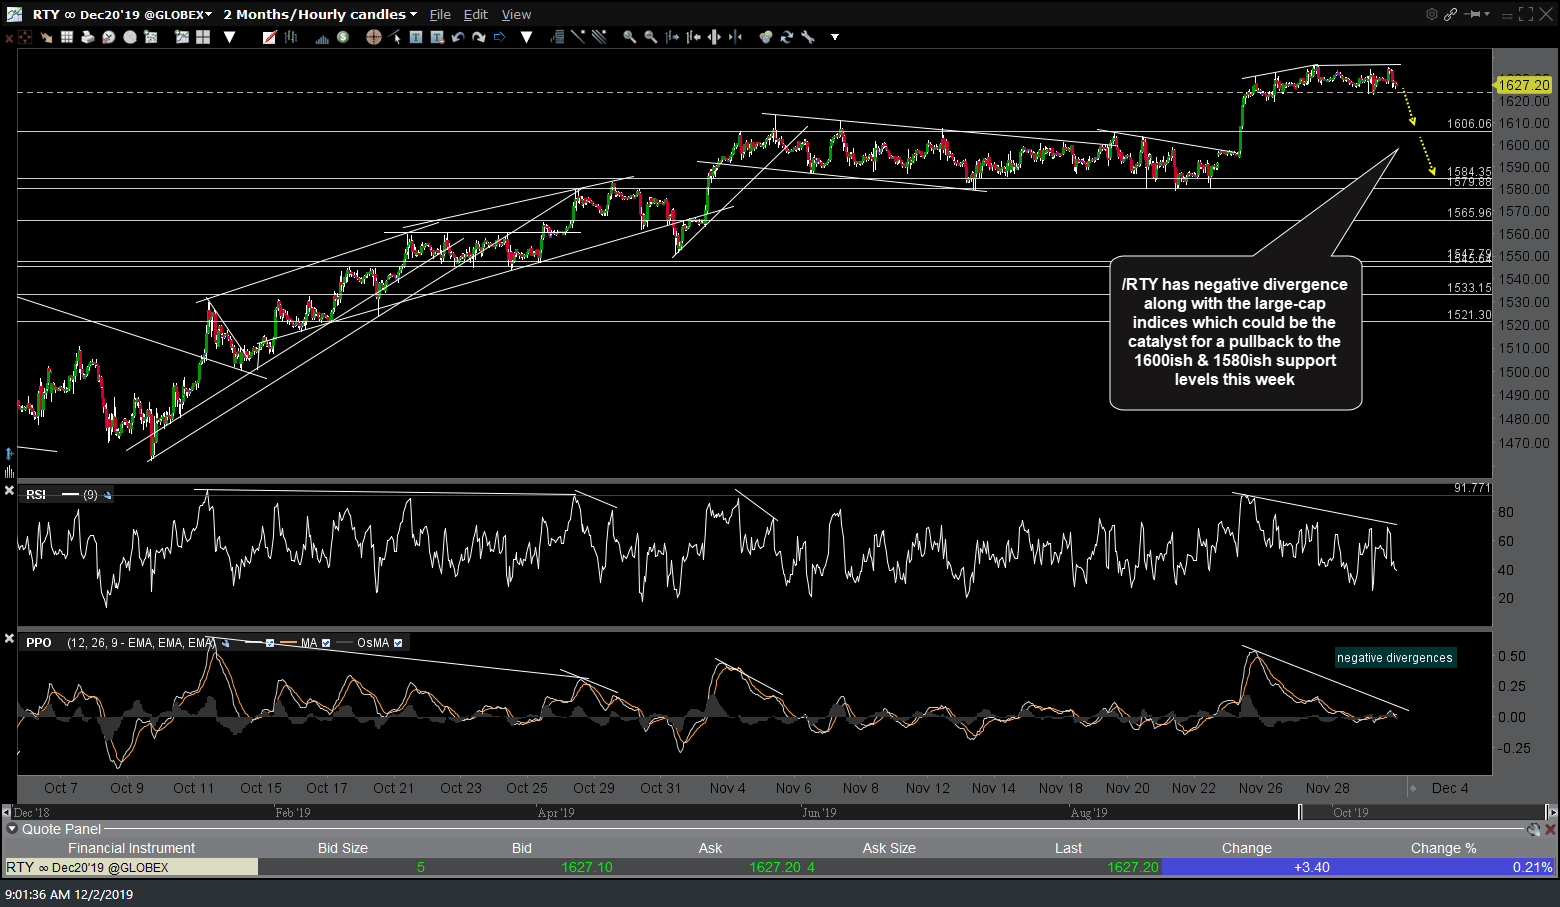
RTY 60m Dec 2nd