
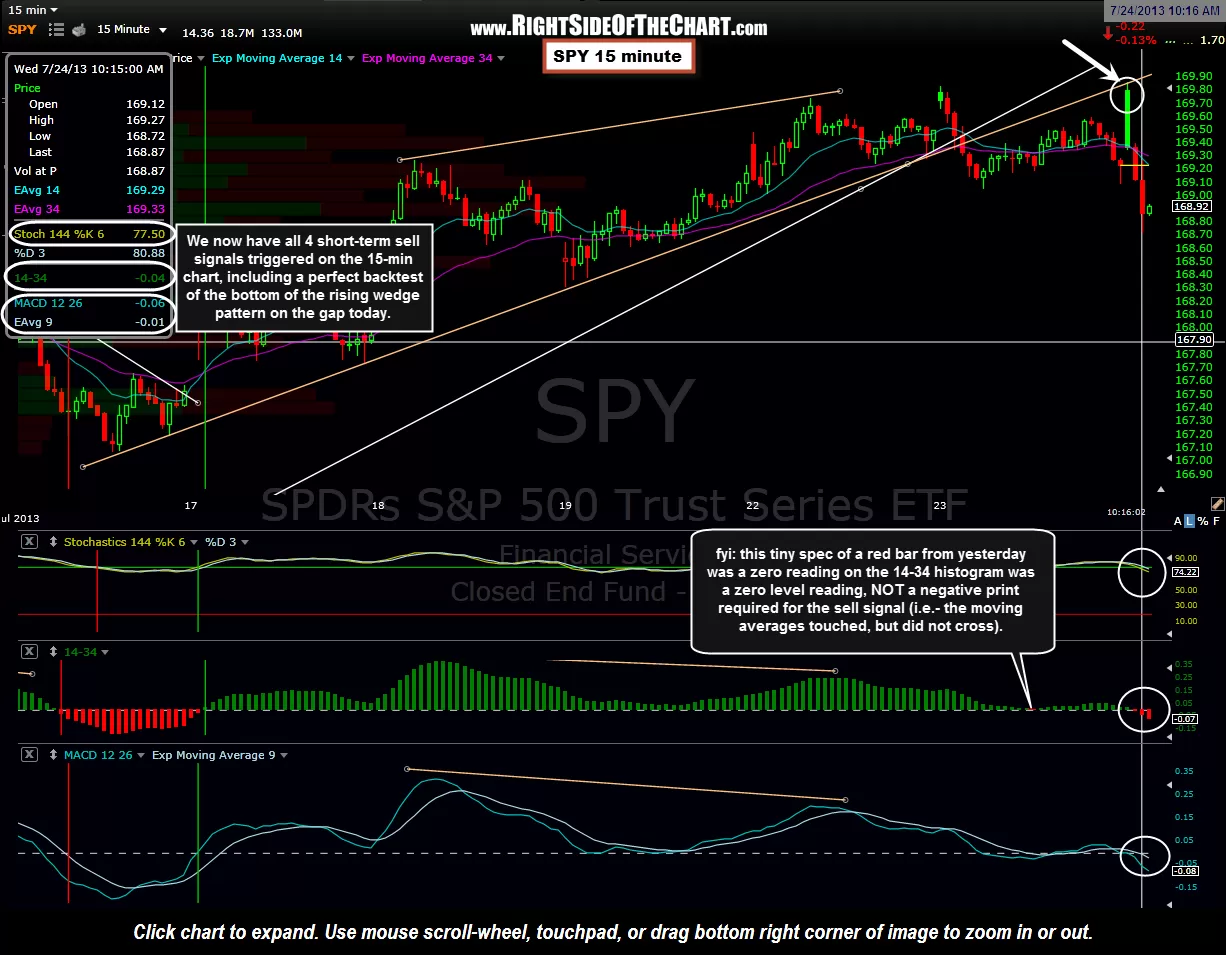
All four of the SPY 15 minute sell signals recently discussed have all triggered follow as perfect backtest of the orange rising wedge pattern on the opening gap today. With all three of the oscillators/indicators firing in sync on the same 15 minute bar today immediate following the perfect kiss of the bottom of that recent broken wedge pattern (the fourth signal), the odds are good that this one sticks. Even if we were to see a whipsaw from this signal, one should always put a higher weighting in the longer-term charts such as the 60 minute & daily periods charts, which have both been building increasing bearish divergences and other red flags. The first chart below is the 15 minute SPY (full view) with the second a zoom-in of the same chart highlighting this morning’s sell triggers following the 15 minute period close.
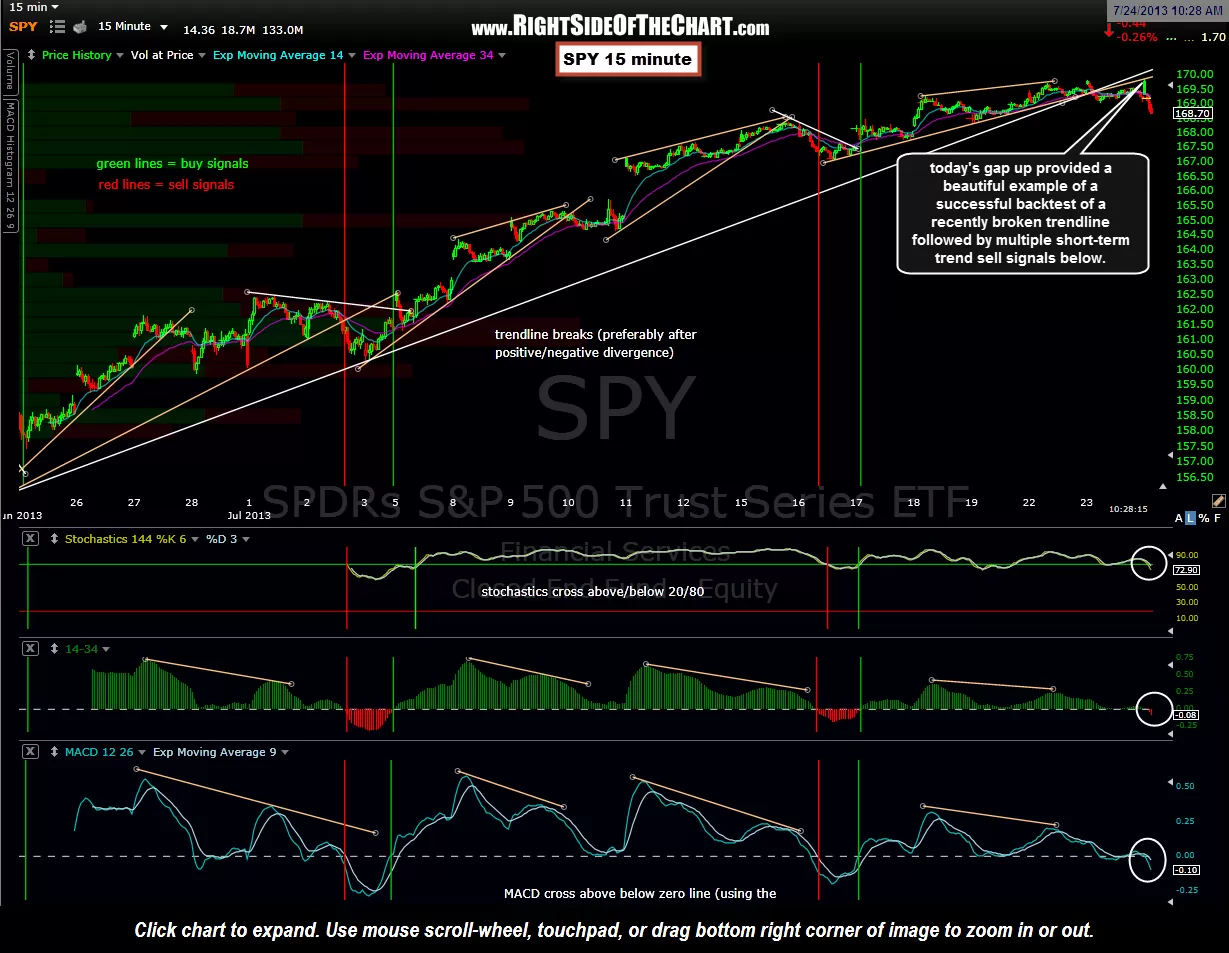
Essentially, we have what I refer to as a bearish “stacking” of the charts. When the charts are stacked (either bullish or bearish), it means that we’ve been in a relatively long standing trend (up or down) with all time frames currently aligned with the trend (bullish or bearish). However, we then have bearish (or bullish), technicals setting up on multiple time frames such as a rising wedge or channel with negative divergences in place. When things line up just right, the shorter-term bullish or bearish chart pattern formations are more advanced as you go down on the time frames.
We’ll use the current stacking of the SPY as example. The 15 minute charts above show how that time frame, although in a solid uptrend since June 24th, has been been building increasing warning signs that a trend change was likely to take place very soon (as evidenced by the primary uptrend line break; the recent lower successive peaks on the oscillators & indicators which indicates waning momentum; negative divergences, etc…)
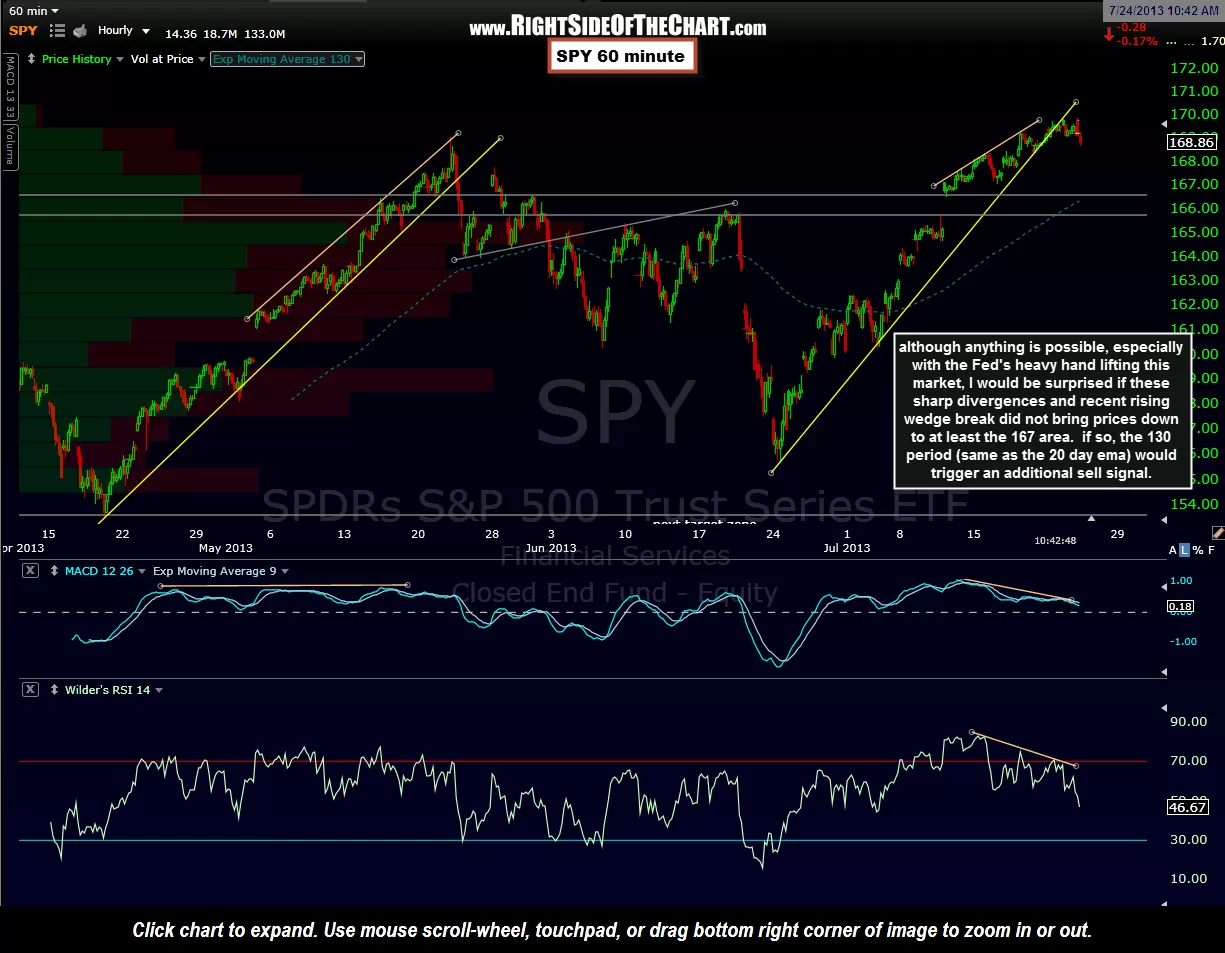
Meanwhile the 60 minute SPY chart (1st below), as also previous discussed, was also in an uptrend which was defined by a very steep (aka- unsustainable) and quite extended trendline. The “bearish” warning signs, however, only began to manifest recent when the MACD & RSI began diverging sharply from prices and a rising wedge pattern began to materialize (July 11th – 18th). After those divergences were “confirmed” via the bearish crossover in the MACD while at a lower high as well as the RSI rolling over, the next bearish event came when prices broke below the uptrend line on July 23rd.
Finally, that brings us to the daily chart (2nd below). I think by now the gist of this “stacking” process is clear but just to clarify, the daily SPY, although unarguably well entrenched in an uptrend, is rapidly building potentially bearish divergences as prices make higher highs while the MACD & RSI not only fail to do so but are now in the early stages of rolling over. Once (if) the MACD line crosses down below the signal line and the RSI moves lower, the negative divergences will have changed from potential to confirmed. I discuss divergences, both positive and negative, extensively on RSOTC.com and that is because although nothing is 100% in trading, my experience has been that divergences, once confirmed and when aligned with bullish or bearish price patterns, play out for a tradeable trend reversal much more often than not. Again, do not confuse potential divergences with confirmed divergences as potential divergences are often negated with prices moving higher (or lower) before the indicator makes a higher (or lower) highs.
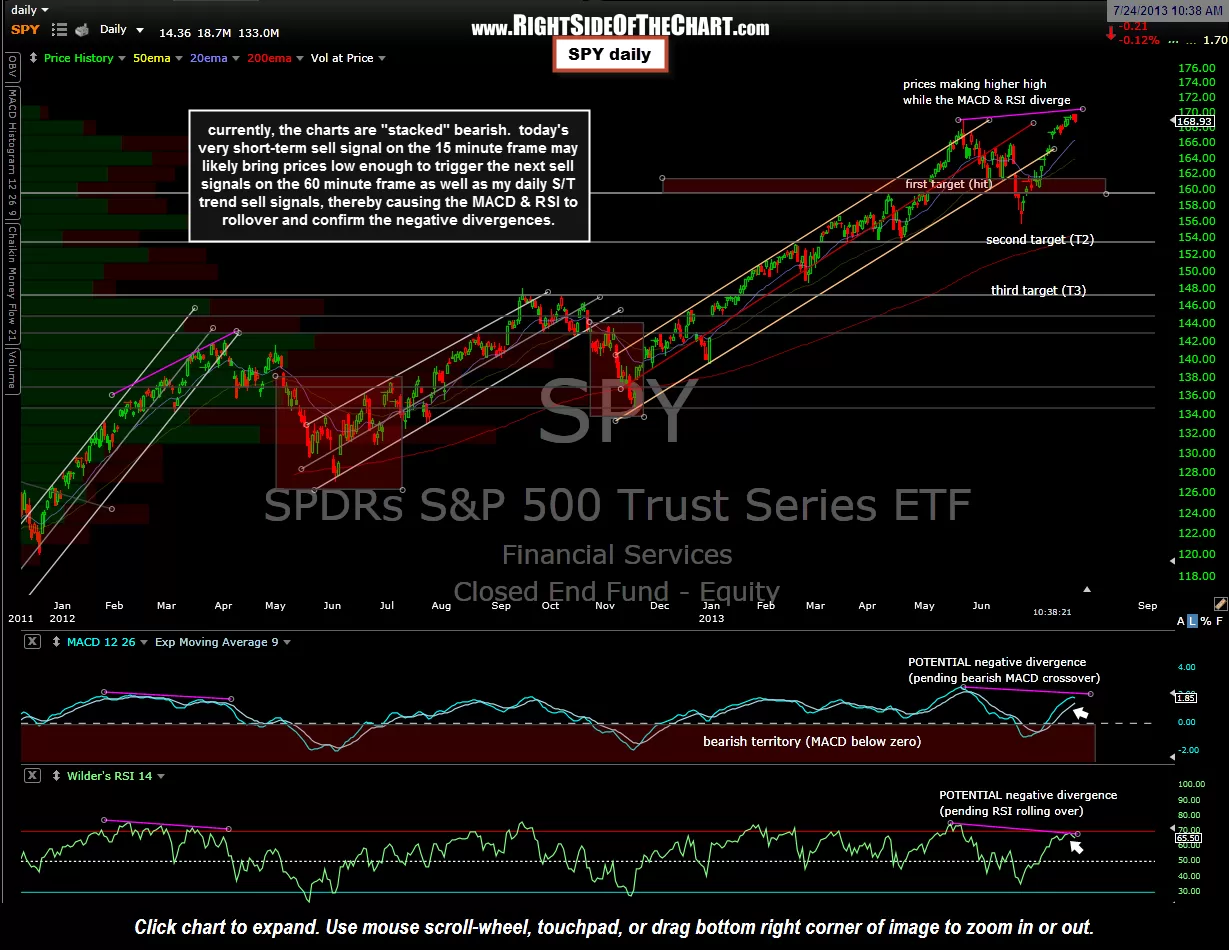
The bottom line is that IF this most recent 15 minute sell signal plays out for an typical correction commensurate with the time frame of the chart, that will most likely cause the longer-term charts to also become more bearish & likely confirm the divergences building on the daily time frame, not to mention triggering some of the other recently covered short-term & intermediate-term daily sell signals. However, we can only take things one step at a time. Step one would be to continue see a four triggers on the 15 minute chart remain on a sell signal throughout today and a red close with some impulsive selling today would help. We’ll have to monitor any correction as it unfolds, paying close attention to how prices act as they approach horizontal & trendline support levels, as well as other metrics such as market breadth, volume patterns, etc…