
SSG (2x short semiconductor sector ETF) offers an objective long entry or the start of a scale-in swing short position on the semis anywhere from the 13.00ish gap support down to but not below 12.00 & will be added as an Active Short Trade (you go LONG or buy SSG to short the semis) here around current levels (~13.20). Daily chart below.

SSG daily March 30th
The current price targets for this trade are T1 at 14.74 & T2 at 17.23 with additional targets likely to be added, depending on how the charts of the semiconductor sector, as well as the broad market, develop going forwards. The suggested stop on a daily close below 11.70. To account for the 200% leverage, the suggested beta-adjusted position size for this trade will be 0.50 (i.e.- about half of a typical position on SPY or QQQ).
I opted to used SSG as the proxy for this trade as it allows those without the ability to short in a margin account, to gain short exposure to the semiconductor sector. While I often use SOXS (3x short the PHLX SOXX Semiconductor Sector ETF) as my proxy for shorting the semis, I am open to this trade morphing into a multi-month swing or trend trade and as such, the decay from the 2x leveraged SSG should be less than that of the 3x SOXS, should the semis experience a lot of back & forth chop, bear market rallies, and/or consolidation periods in the coming months. A description of how the decay from leveraged ETFs works can be viewed here.
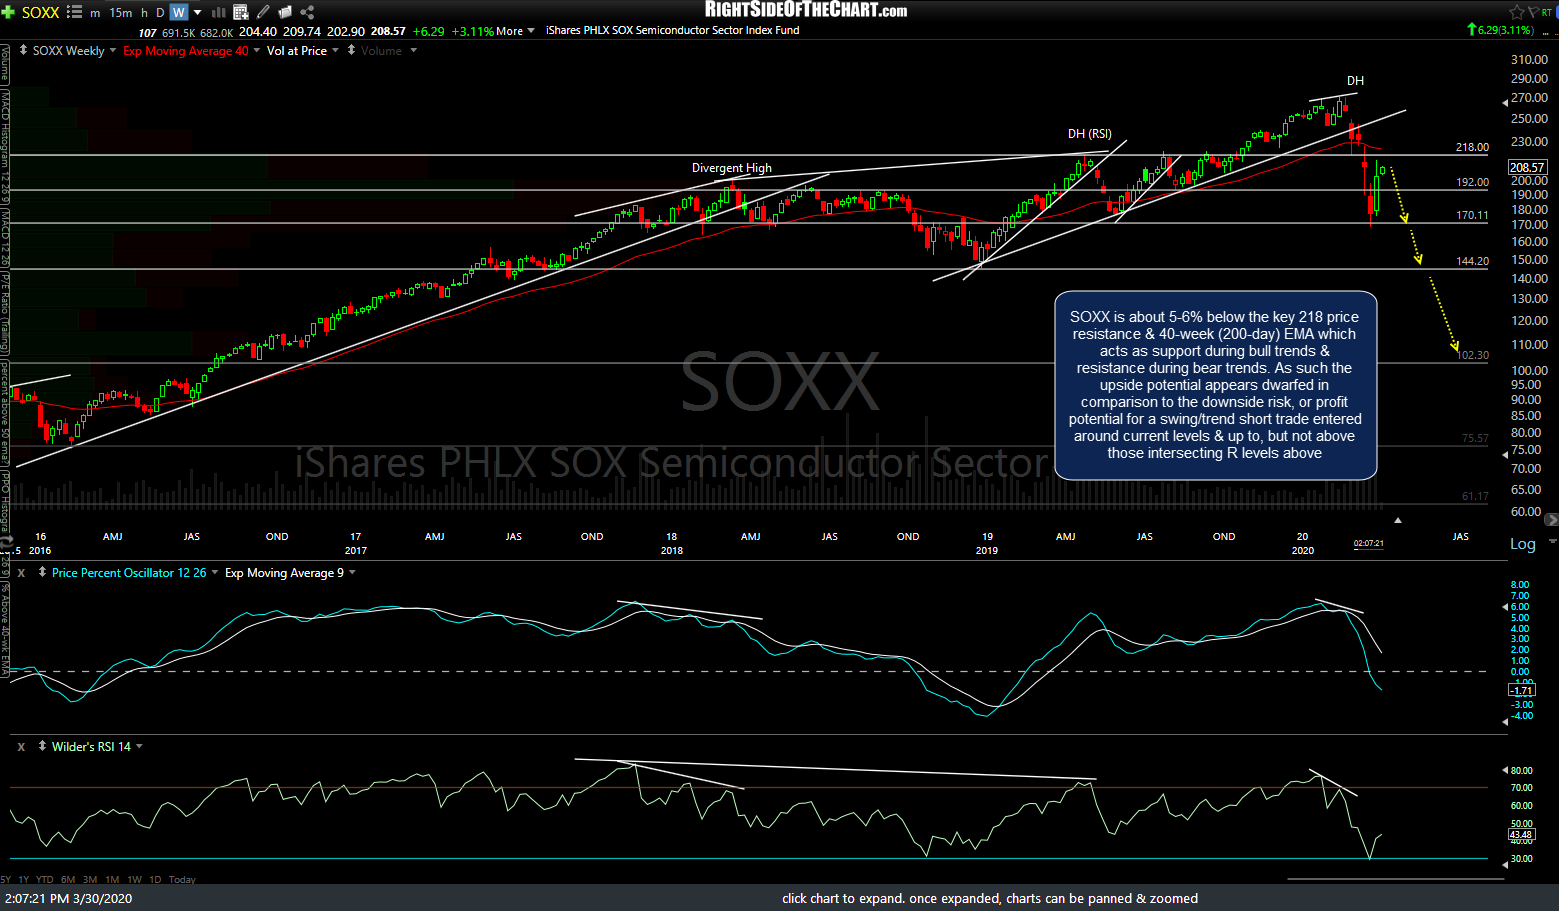
SOXX weekly March 30th
SSG tracks the Dow Jones Semiconductor sector while SOXX (as well as SOXL & SOXS) tracks the PHLX SOXX Semiconductor Sector. SOXX is about 5-6% below the key 218 price resistance & 40-week (200-day) EMA which acts as support during bull trends & resistance during bear trends. As such the upside potential appears dwarfed in comparison to the downside risk, or profit potential for a swing/trend short trade entered around current levels & up to, but not above those intersecting resistance levels above. Weekly chart above.